Surface Roughness from Large-Scale Laser Scanning Point Clouds for Urban Accessibility Analysis

Peer-reviewed
Journal Article
Surface macrotexture is of major interest for barrier-free routing, particularly for wheelchair travellers, because it relates to the functional properties of pavements, such as loss of energy through tyre-rolling …
Author

Hollenstein, D., Ammann, M., Grimm, D. E., and Bleisch, S.

Published

2026

Doi

[pdf]

Abstract

Surface macrotexture is of major interest for barrier-free routing, particularly for wheelchair travellers, because it relates to the functional properties of pavements, such as loss of energy through tyre-rolling resistance or vibrational discomfort. These functional properties are difficult to assess. The measurement and characterization of pavement macrotexture, therefore, is a promising approach to support safe route choice for wheelchair travellers and to provide comparative quality criteria for inclusive urban infrastructure management and planning. We use 3D point clouds from terrestrial laser scanning (TLS) and suggest a set of surface roughness parameters tailored to assess the accessibility of urban pavements at the micro-level. We explore the sensitivity of the parameters to point cloud resampling and apply them to a real-world dataset with eleven different pavements. In spite of value variation related to scanning distance and coverage, our results indicate that combining median-based versions of Average Roughness and Simulated Texture Depth together with parameters tailored to quantify the depth and proportion of joints and the roughness of the contact area facilitates the grouping and comparison of surfaces regarding barrier-free mobility. The results of this work will be integrated into a framework for accessibility analysis and barrier-free routing.

Figures
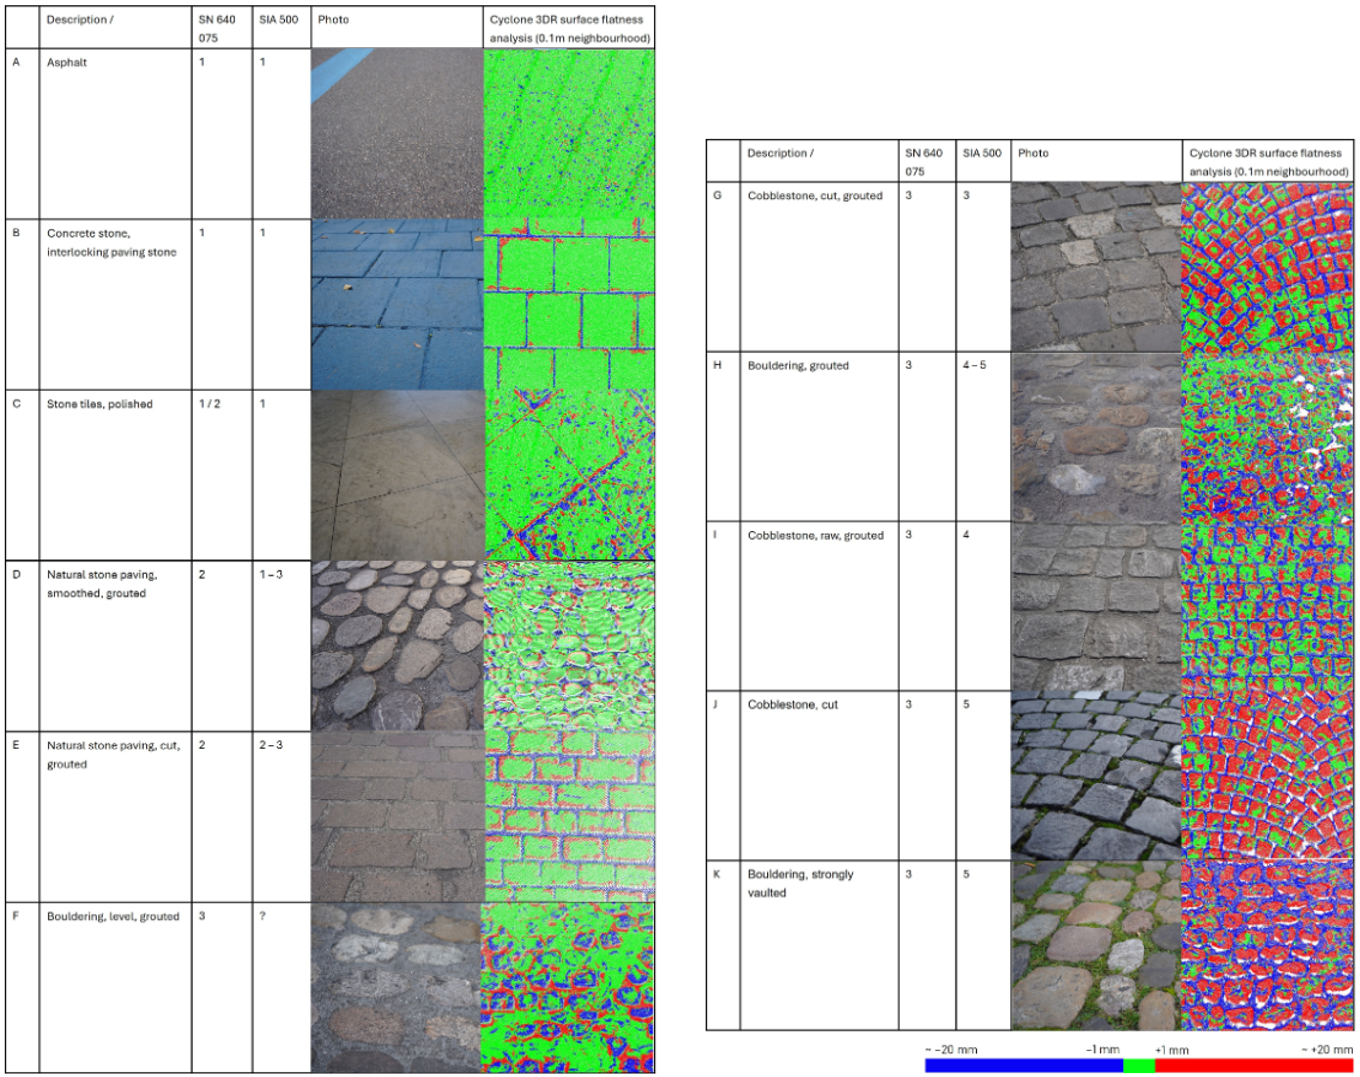
Pavement types identified within the scanned area and ordered tentatively according to their descending suitability for wheelchair users from A to K based on an expert interview. In columns SN 640 075 [7] and SIA 500 [45], the pavements are graded according to the respective guideline (SN 640 075: 1: good, 2: limited suitability, 3: unsuited; SIA 500: 1: good, 2: suitable, 3: limited suitability, 4: little suitability, 5: unsuited). SIA 500 rates pavements with respect to rolling resistance and comfort, risk of tripping, and skid resistance. We did not consider the latter, since skid resistance is related also to pavement microtexture, which is out of the scope of the chosen data acquisition technology.

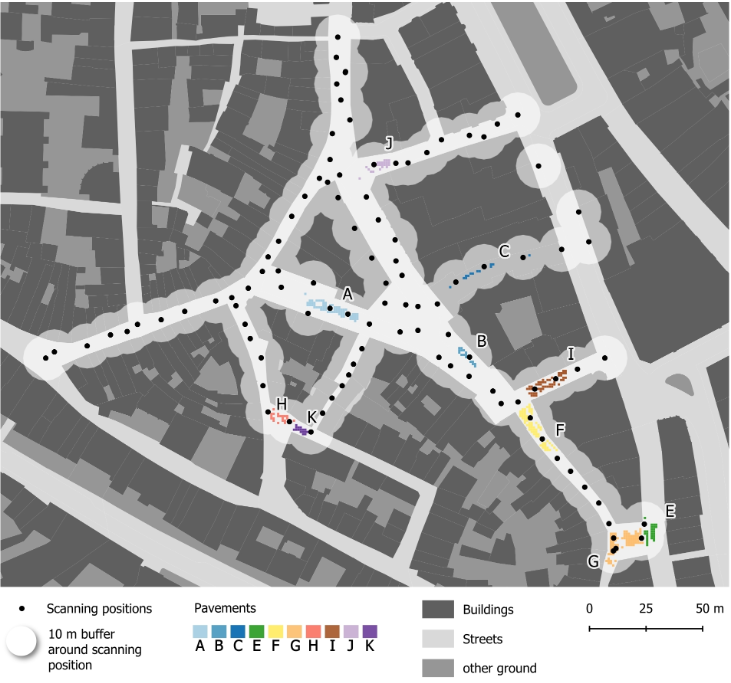
Map of the study area with positions of laser scanning setups, point cloud coverage and location of pavement samples in data set II. The samples are colour-coded according to pavement type A–K. Pavement D is outside the displayed area. (Data of background map: Grundbuch- und Vermessungsamt Kanton Basel-Stadt 2026).

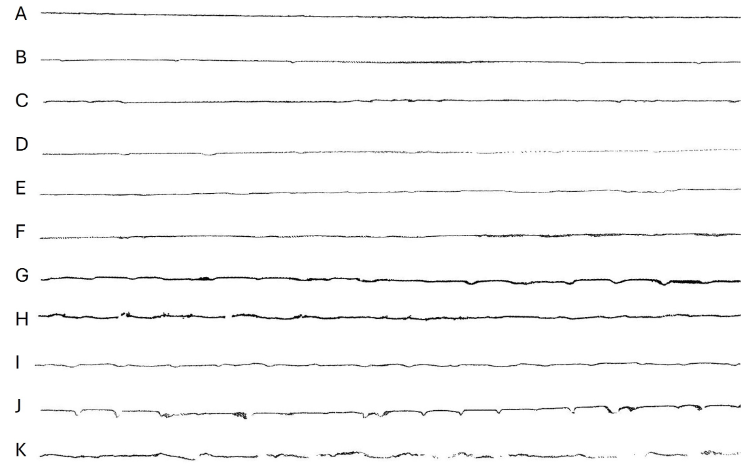
Lateral view on sections of the reference sample for each pavement (A–K). Pavement A was rated most accessible; pavement K was rated least accessible in an expert evaluation.

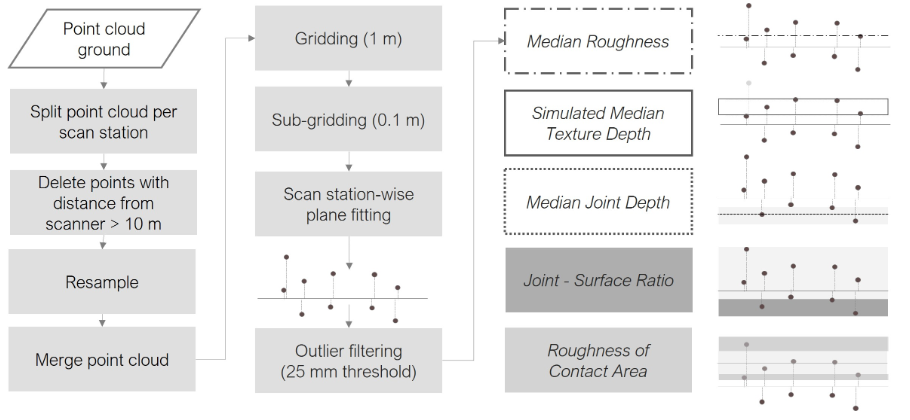
Steps of point cloud processing and parameter computation. The signature of outlines and backgrounds of parameter names in the third column corresponds with that of lines and areas in the diagrams of the rightmost column which illustrate the computation of the respective parameter.

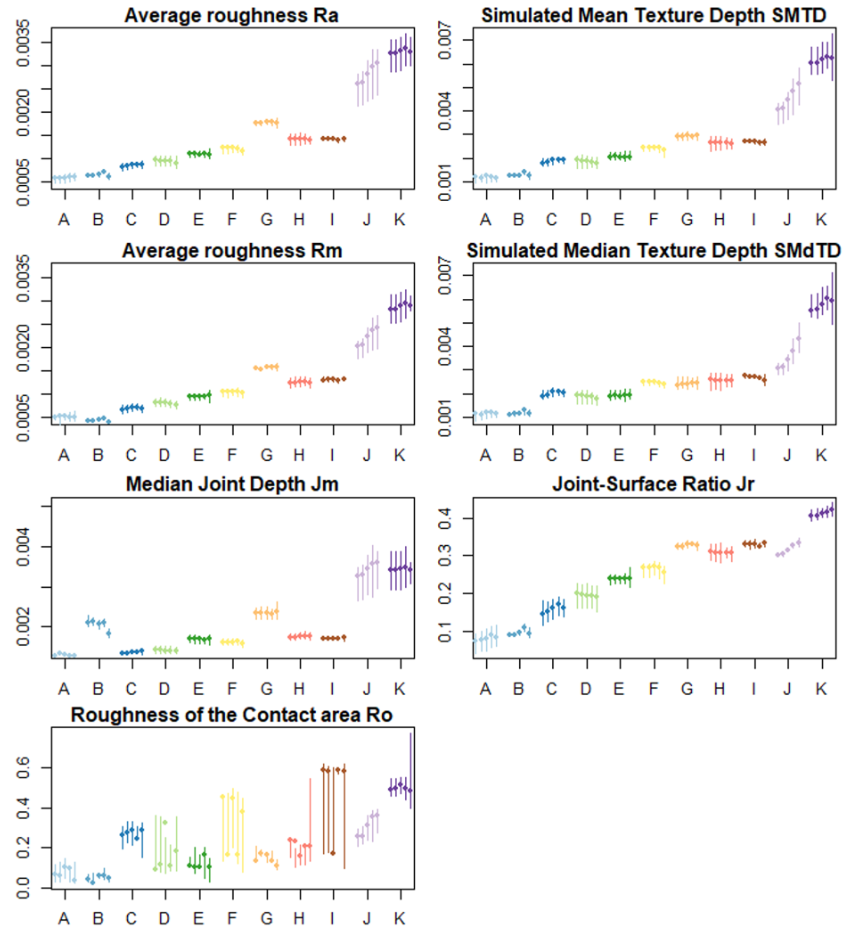
Parameter sensitivity to point cloud resampling: Circles indicate parameter values computed on 1 m × 1 m sampling units; vertical lines indicate the value ranges of the respective 0.5 m × 0.5 m sub-cells along the y-axis for each pavement type (A–K, colour-coded) and each level of resampling (per pavement type, from left to right: not resampled, 2 mm, 5 mm, 10 mm, 20 mm average point distance). The top row shows results for mean-based Average Roughness Ra and SMTD; the second row shows results for the median-based versions of these parameters, Rm and SMdTD. Y-axis units for Ra, Rm, SMTD, SMdTD and Jm: m; y-axis for Jr and Ro are unitless (theoretical range: 0–1). We do not expect that the ranking of pavements by Jm and Jr corresponds with the ranking by average roughness or Simulated Texture Depth. Large but shallow joints do not necessarily lead to high overall roughness.

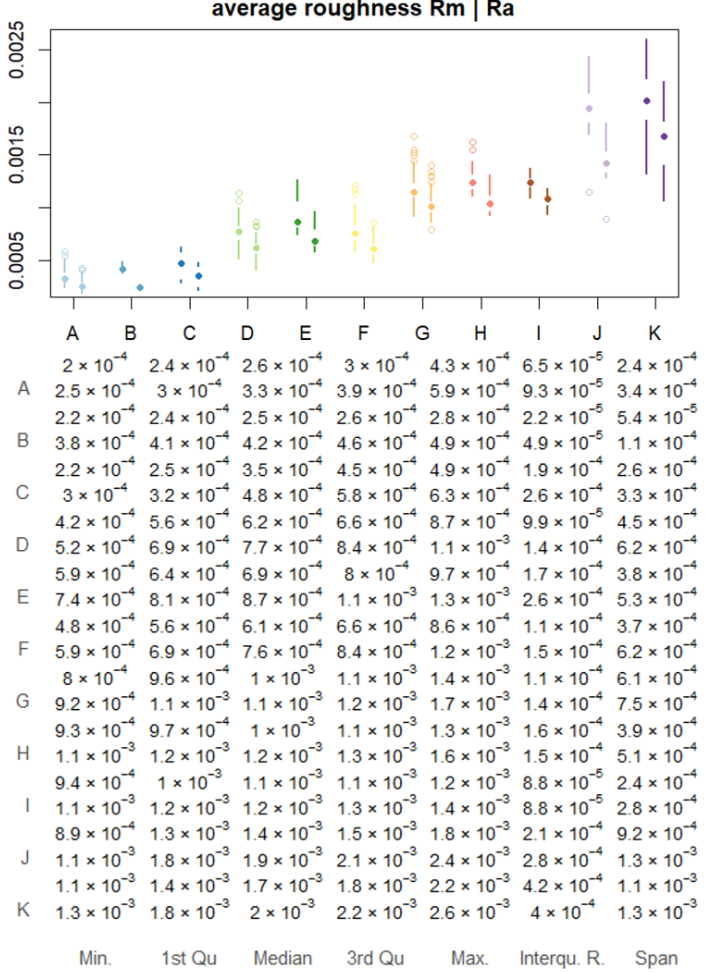
Comparison of mean-based (Ra) and median-based (Rm) versions of Average Roughness. (Top): box-and-whiskers plots of samples per pavement type (along x-axis: A–K, colour coded) in data set II (multiple scans per sample, resampled to 10 mm average point distance) for mean-based (left) and for median-based (right) versions of the parameter (y-axis unit: m). (Bottom): Table of minimum (Min.), first quartile (1st Qu.), median, third quartile (3rd Qu.), maximum (Max.), interquartile range (Interqu. R.) and span of values per pavement (A–K) for the median-based (top) and mean-based (bottom) versions of Average Roughness.

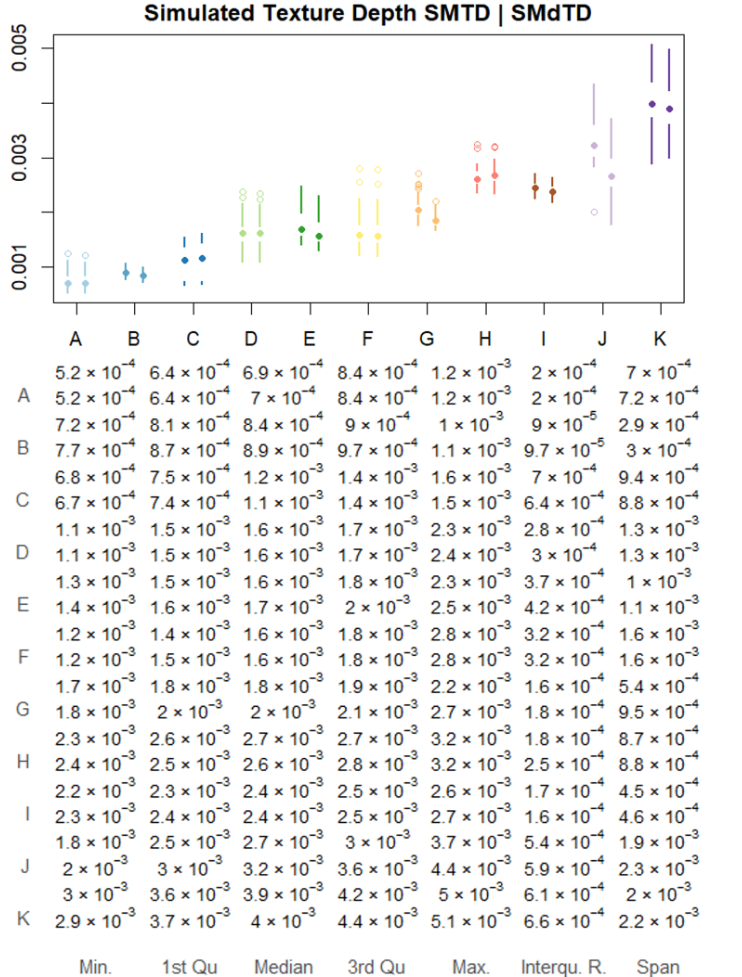
Comparison of mean-based (SMTD) and median-based (SMdTD) versions of Simulated Texture Depth. (Top): box-and-whiskers plots of samples per pavement type (along x-axis: A–K, colour-coded) in data set II (multiple scans per sample, resampled to 10 mm average point distance) for mean-based (left) and for median-based (right) versions of the parameter (y-axis unit: m). (Bottom): Table of minimum (Min.), first quartile (1st Qu.), median, third quartile (3rd Qu.), maximum (Max.), interquartile range (Interqu. R.) and span of values per pavement (A–K) for the median-based (top) and mean-based (bottom) versions of Simulated Texture Depth.

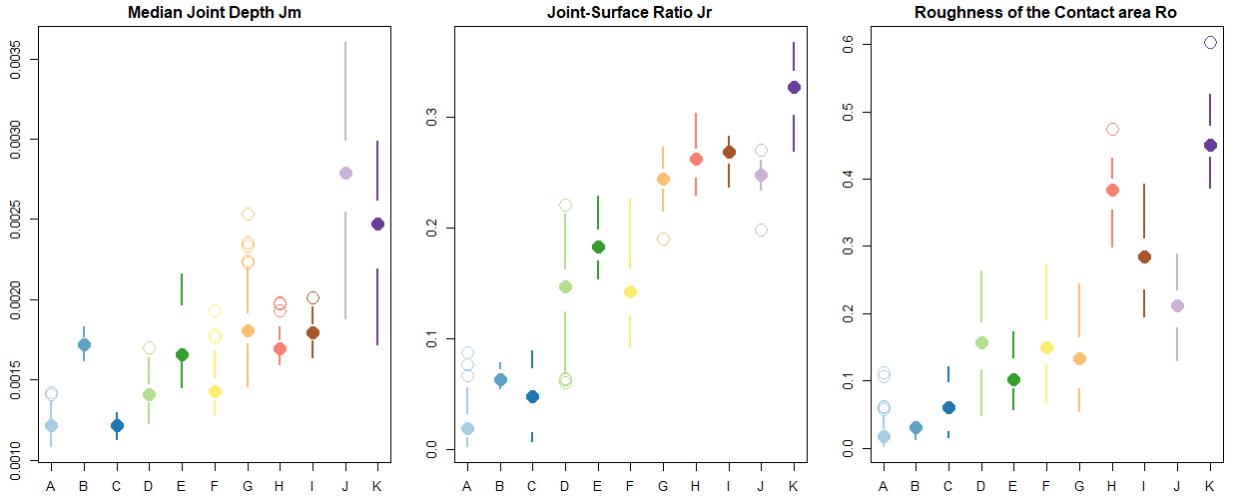
Box-and-whisker plots for parameter values of Jm (unit: m), Jr and Ro (unitless, theoretical range: 0–1) per pavement (along x-axis: A–K, colour-coded) in data set II (multi-scan, resampled to 10 mm average point distance).

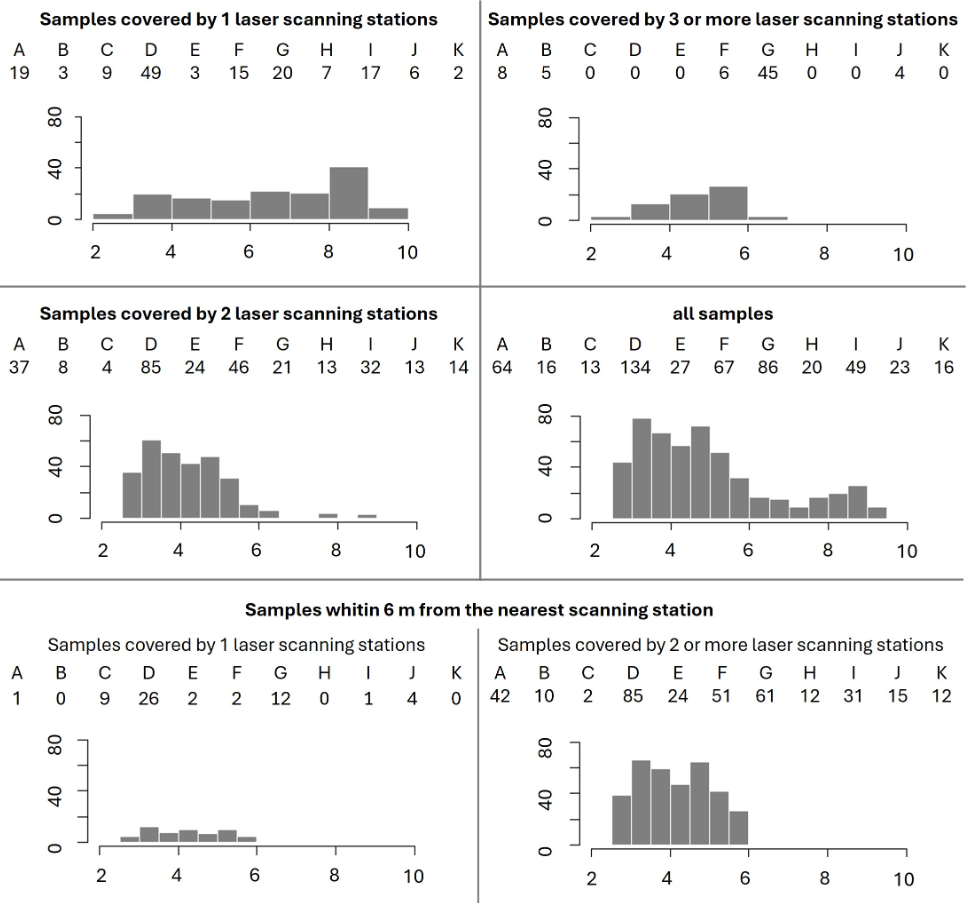
The distribution of surfaces samples across different pavements (A–K) and distance from the nearest laser scanning station (along the x-axis) for different coverage by scanning stations in data set II (top) and in reduced data set II with samples within 6 m from the nearest laser scanning station

Additive measure from all parameters (theoretical value range: 0–5) calculated on data set II. Each parameter is scaled to the range of a theoretical minimum (0) and a theoretical maximum (Rm: 0.0125 m, SMdTD: 0.025 m, Jm: 0.0125 m, Jr: 0.6 and Ro: 1) and then added to the composite measure. The value for each sampling unit is plotted along the x-axis. The vertical scattering is random to improve readability. The circles are colour-coded according to pavement type (A–K). Letters indicate the mean values per pavement (A–K). Samples of different surface types are not necessarily expected to be separated without overlap, but overall ordering is expected to correspond to the ranking established in Section 3.2.

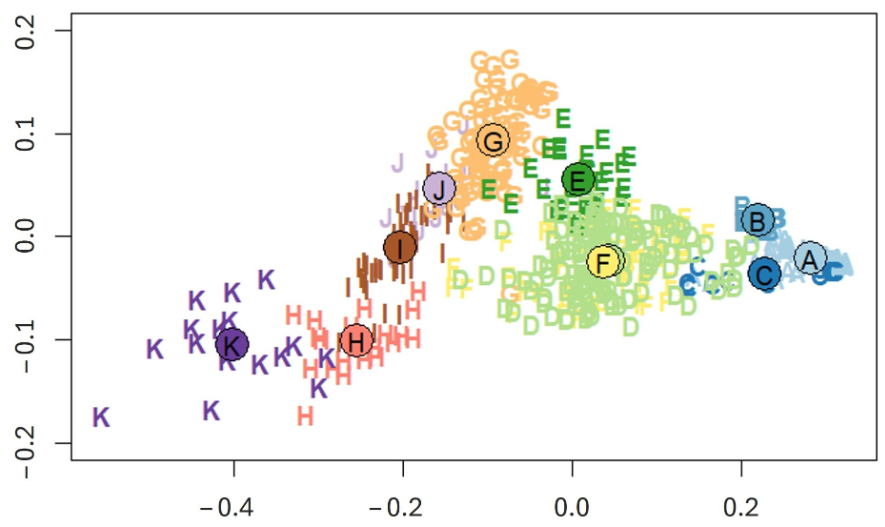
Result of metric multi-dimensional scaling on vectors of parameter values in data set II. Values for each parameter are scaled to the range of a theoretical minimum (0) and a theoretical maximum (Rm: 0.0125 m, SMdTD: 0.025 m, Jm: 0.0125 m, Jr: 0.6 and Ro: 1). Each sampling unit is plotted as a letter (A–K) indicating the pavement type. Circled letters are positioned at pavement means (A–K). Axes are unitless.

BibTeX

@article{hollenstein_surfaceRoughnessSmartCities_2026,
 abstract = {Surface macrotexture is of major interest for barrier-free routing, particularly for wheelchair travellers, because it relates to the functional properties of pavements, such as loss of energy through tyre-rolling resistance or vibrational discomfort. These functional properties are difficult to assess. The measurement and characterization of pavement macrotexture, therefore, is a promising approach to support safe route choice for wheelchair travellers and to provide comparative quality criteria for inclusive urban infrastructure management and planning. We use 3D point clouds from terrestrial laser scanning (TLS) and suggest a set of surface roughness parameters tailored to assess the accessibility of urban pavements at the micro-level. We explore the sensitivity of the parameters to point cloud resampling and apply them to a real-world dataset with eleven different pavements. In spite of value variation related to scanning distance and coverage, our results indicate that combining median-based versions of Average Roughness and Simulated Texture Depth together with parameters tailored to quantify the depth and proportion of joints and the roughness of the contact area facilitates the grouping and comparison of surfaces regarding barrier-free mobility. The results of this work will be integrated into a framework for accessibility analysis and barrier-free routing.},
 author = {Hollenstein, Daria and Ammann, Manuela and Grimm, David Eugen and Bleisch, Susanne},
 doi = {10.3390/smartcities9090146},
 journal = {Smart Cities},
 number = {9},
 title = {Surface Roughness from Large-Scale Laser Scanning Point Clouds for Urban Accessibility Analysis},
 url = {https://www.mdpi.com/2624-6511/9/9/146},
 volume = {9},
 year = {2026}
}