Gaining overview with transient focus+context maps

Peer-reviewed
Journal Article
Gaining an overview of large spatial data sets presents a challenge common to various domains. ’Overviewing’ spatial data involves viewing different areas of focus and context at different scales and requires access to …
Author

Hollenstein, D., and Bleisch, S.

Published

2021

Doi

[pdf]

Abstract

Gaining an overview of large spatial data sets presents a challenge common to various domains. ’Overviewing’ spatial data involves viewing different areas of focus and context at different scales and requires access to detail from zoomed-out views. Standard pan and zoom interfaces provide limited support with this. Motivated by the application scenario of flood risk monitoring, we extend pan and zoom affordances with a combination of focus+context techniques and multiple maps to support ’overviewing’ spatial data with a graph-like information structure. A combination of transient overlays to preview context-ondemand as well as detail-on-demand with the option to decouple additional maps enables fast navigation through the graph-like information space. User-created and -positioned, resizable multiple maps allow for simultaneous exploration of distant regions at flexible scales. The seamless integration of these concepts and the versatility of its components allow for continuously adaptable, user-defined layouts that support various analysis situations. We present a prototype implementation of this interaction model and illustrate its working in application to a hydrometric network, but we believe the model could be transferred to graph-like data in other domains.

Figures
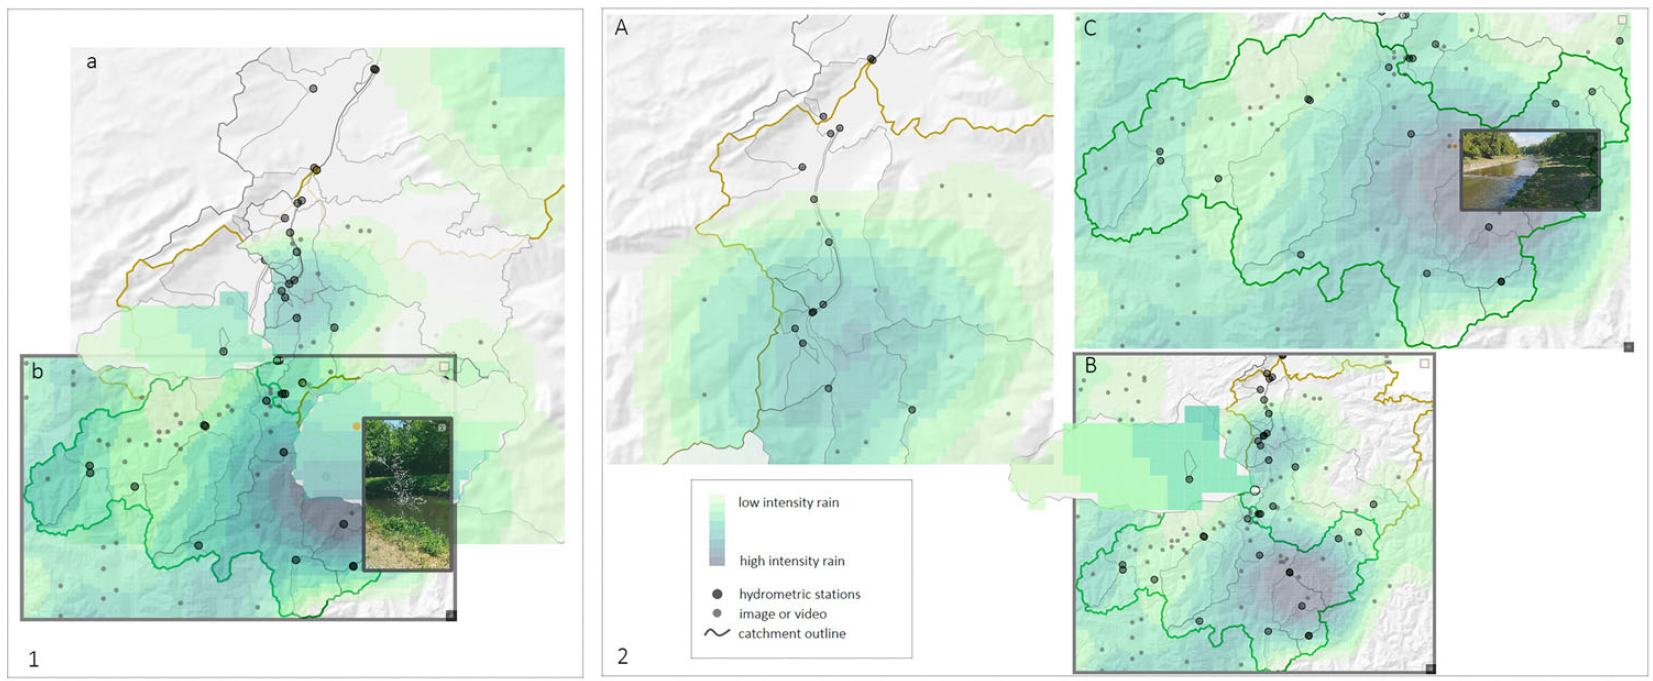
Two screenshots [1,2] of the prototype application illustrating interaction and use of multiple maps for fast navigation and overview of a graph-like information space (a hydrometric network of stations and catchments): [1] shows a map [a] zoomed-in to a downstream area of focus and a downscaled overlay of the main catchment branch that gives access to remote regions of interest. From this, a map [b] of the main upstream catchment is decoupled (active view with grey boarder), in which small catchments are enlarged to access detail that is distant, but relevant to the area at focus in [a]. [2] shows an alternative user-created arrangement of views with a highscale view of a downstream area of focus [A], a low-scale overview of the river system [B] that was decoupled from [A] (active view, with a transient overlay to inspect a small catchment branch), and a sized-up view of the upstream area [C] that was decoupled from [B]. The order of decoupling is inferred from the linked highlighting of catchment outlines in the parent and child map. (Data sources: hydrometric network (Schwanbeck et al., 2018), relief: swisstopo).

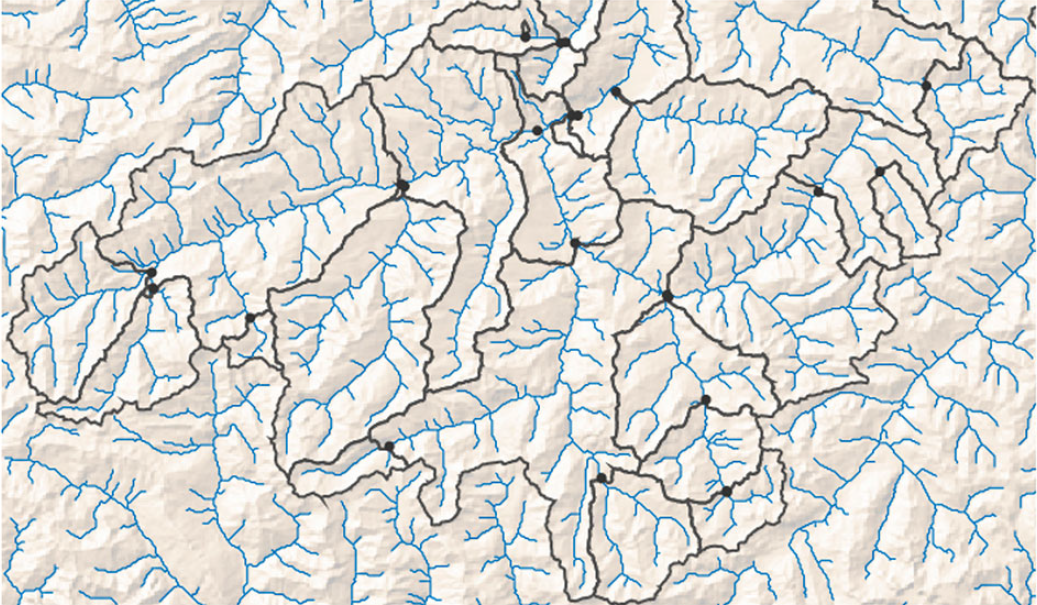
Section of a hydrometric network composed of hydrometric stations [points] and their catchments [dark grey outlines], flow direction roughly south to north. (Data sources: stations and catchments (Schwanbeck et al., 2018), relief: Swisstopo).

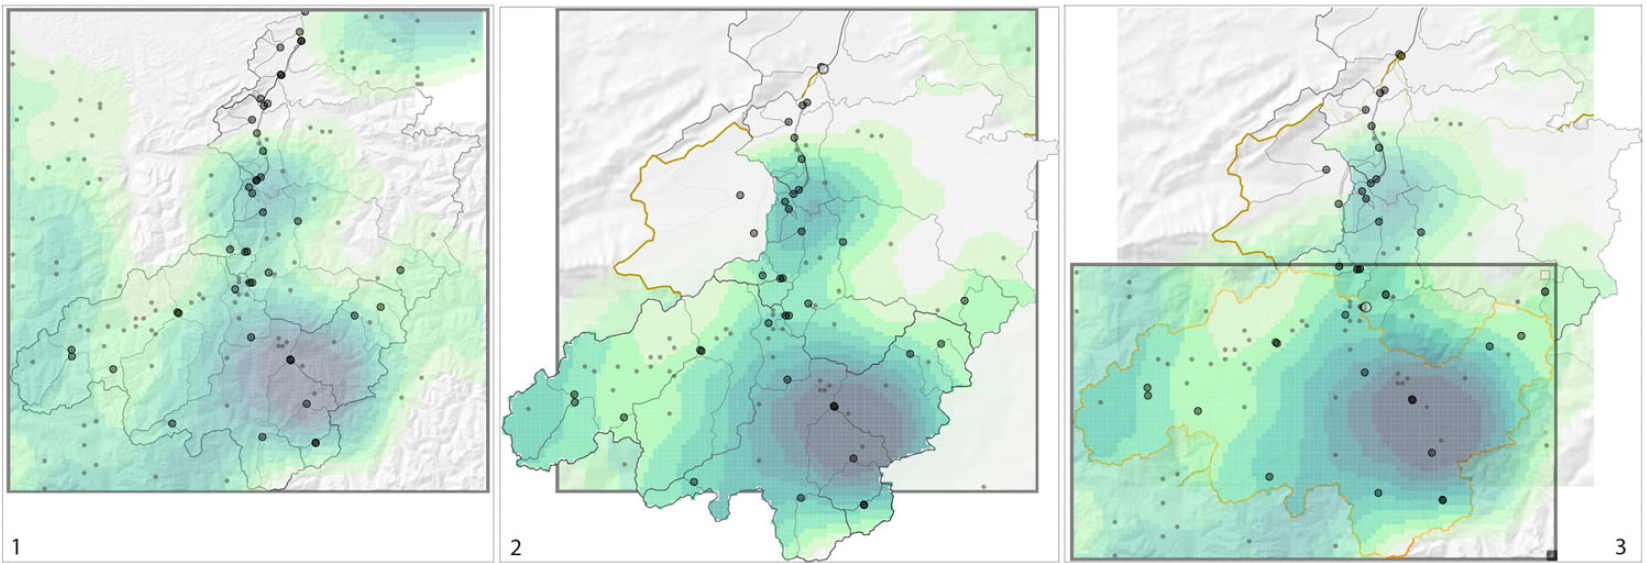
Consecutive screenshots of the prototype application [1–3] showing the step-wise decoupling of an additional linked map of a remote region of interest: [1] Initial map view showing the entire data extent (catchment branches in a river system, flow direction roughly south to north). [2] The user zoomed to a downstream region of interest and turned on a transient, down-scaled overlay of the main catchment branch that stretches far beyond the map extent at the current zoom level (parent shape highlighted in the base map). [3] From this transient overlay, the user decouples an additional map that is zoomed and sized to show the upstream catchment (outline highlighted in orange). The child map appears in alignment with the parent. It can be re-positioned and resized to fit the user’s needs. (Data sources: hydrometric network (Schwanbeck et al., 2018), relief: swisstopo).

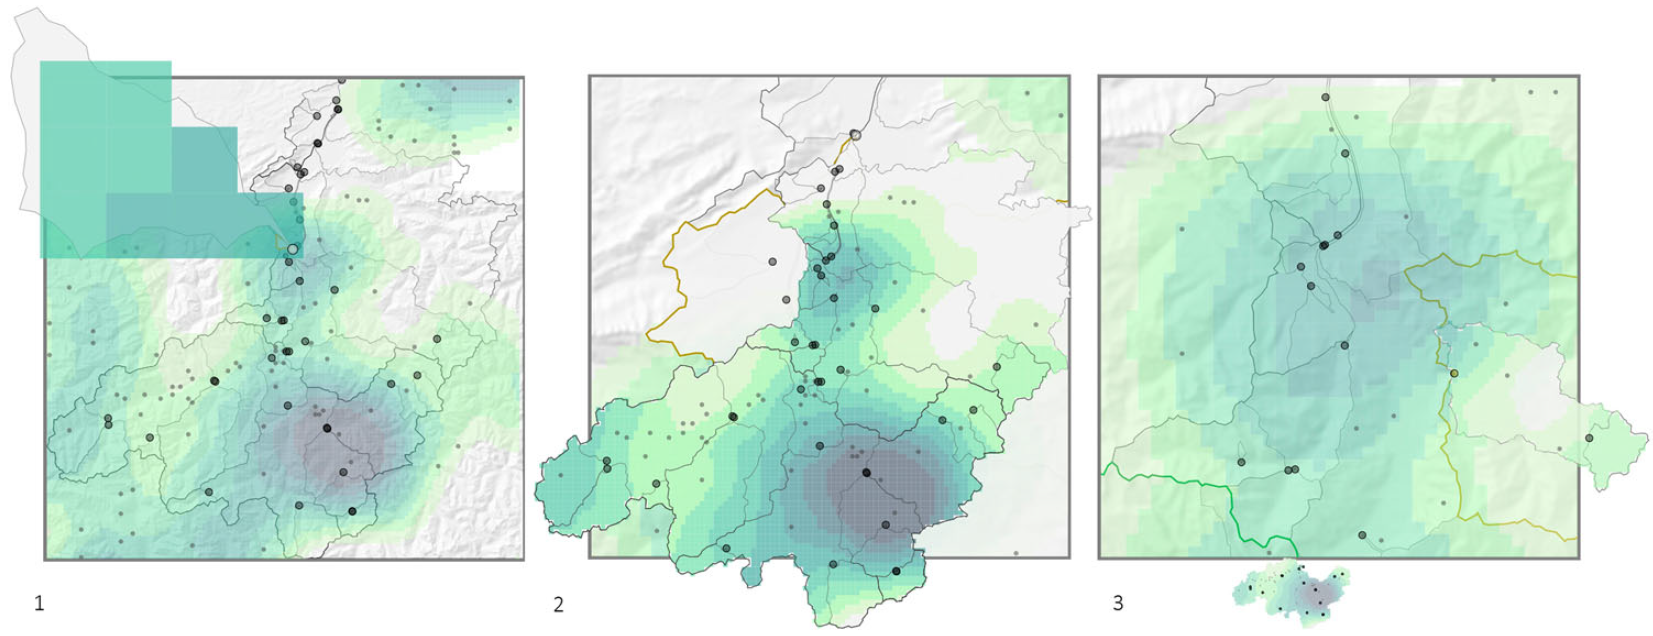
Screenshots of the prototype application [1–3] illustrating the use of dynamically resizing transient overlays to access detail [1] and preview context on-demand [2,3] to the current focus (the scale of maps and overlays is evident from the size of the rain grid cells [km2]). [1] The user turned on an overlay to enlarge a small catchment (outline highlighted in orange in the base map) to access detail from an overview of the river system. [2] The user zoomed to a downstream region of interest and turned on a scaled-down overlay of the main catchment branch to the area at focus. Overlays of catchments are anchored to the base map at the corresponding outlet location and moved and resized dynamically as the user zooms and pans the map. [3] If an anchoring outlet leaves the view, the overlay remains visible and interactive at the map’s margin and re-attaches as the anchoring outlet re-enters the view. (Data sources: hydrometric network (Schwanbeck et al., 2018), relief: swisstopo).

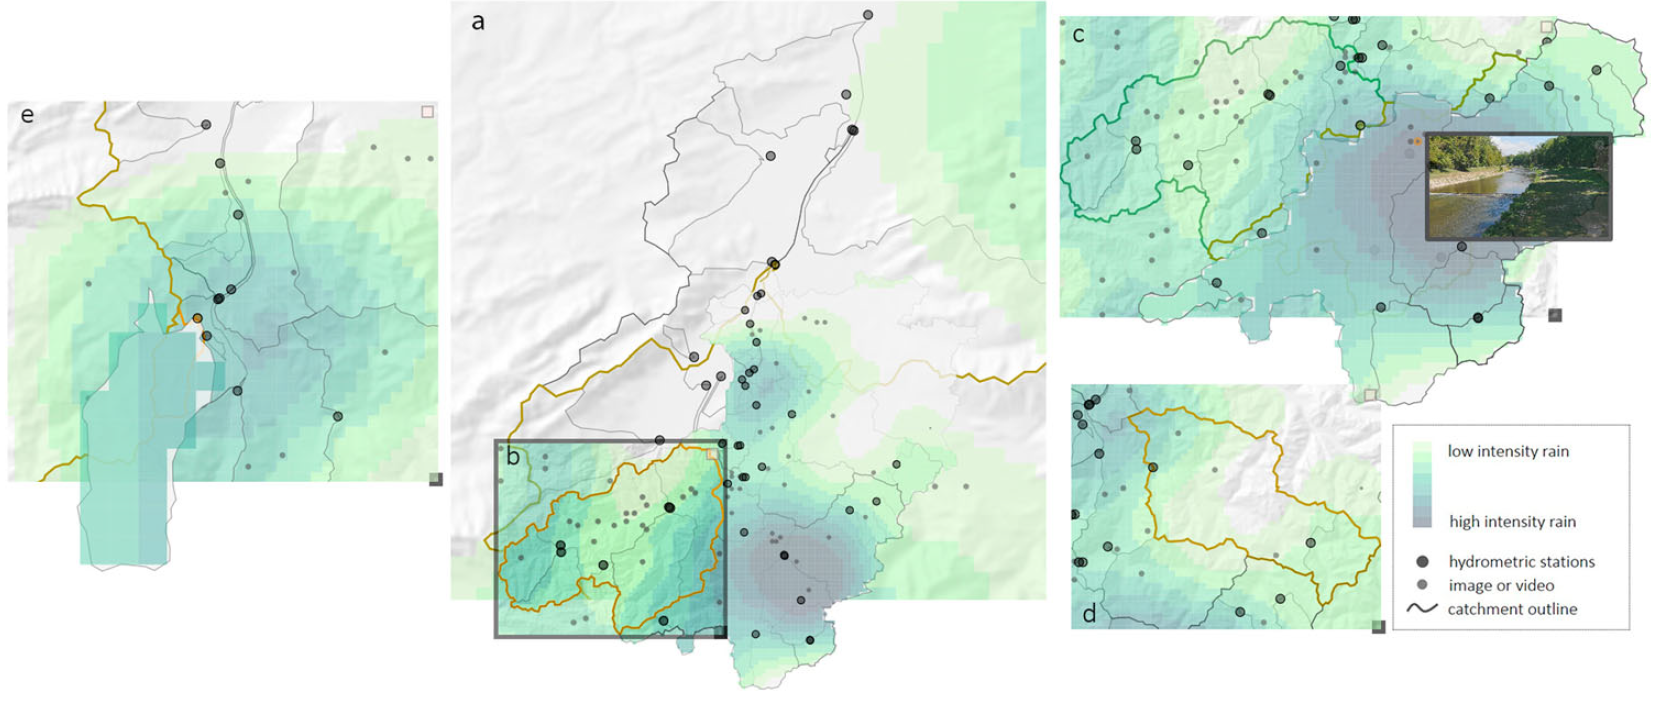
Screenshot of the prototype application showing a state with five user-created and -arranged linked maps [a–e]: [a] Initial map zoomed to a downstream area with a transient overlay of the main catchment branch turned on. From this overlay, the user decoupled a new map [b] (active view with grey boarder) with a particular catchment branch at focus (outline highlighted in orange). The child map appears in alignment with the parent, before it is dragged to a userdefined position and resized according to the users needs. Three more linked maps [c–e] were decoupled; [c] shows the main upstream catchment branch to the focus-area in [a]. An enlarged overlay of a branch of interest is turned on from which a video is accessed. [d] shows a catchment branch adjacent to [c] at a user-defined scale. Both maps [c, d] were initiated from the corresponding outlets in the overlay in [a]. [e] was initialized on the outlet of the main catchment in [a]. [e] was shrunk and zoomed to an area of interest south to the region in [a]. In [e], a small catchment (outline highlighted in orange in the base-map) is inspected in an overlay. (Data sources: hydrometric network (Schwanbeck et al., 2018), relief: swisstopo).

BibTeX

@article{hollenstein_gainingOverviewTransientFocusContext_2021,
 abstract = {Gaining an overview of large spatial data sets presents a challenge common to various domains. ’Overviewing’ spatial data involves viewing different areas of focus and context at different scales and requires access to detail from zoomed-out views. Standard pan and zoom interfaces provide limited support with this. Motivated by the application scenario of flood risk monitoring, we extend pan and zoom affordances with a combination of focus+context techniques and multiple maps to support ’overviewing’ spatial data with a graph-like information structure. A combination of transient overlays to preview context-ondemand as well as detail-on-demand with the option to decouple additional maps enables fast navigation through the graph-like information space. User-created and -positioned, resizable multiple maps allow for simultaneous exploration of distant regions at flexible scales. The seamless integration of these concepts and the versatility of its components allow for continuously adaptable, user-defined layouts that support various analysis situations. We present a prototype implementation of this interaction model and illustrate its working in application to a hydrometric network, but we believe the model could be transferred to graph-like data in other domains.},
 author = {Hollenstein, Daria and Bleisch, Susanne},
 doi = {10.1080/23729333.2021.1960139},
 journal = {International Journal of Cartography},
 number = {1},
 pages = {118--132},
 title = {Gaining overview with transient focus+context maps},
 url = {https://www.tandfonline.com/doi/full/10.1080/23729333.2021.1960139},
 urldate = {2025-03-03},
 volume = {8},
 year = {2021}
}