Evaluating the impact of visualization of wildfire hazard upon decision-making under uncertainty
Abstract
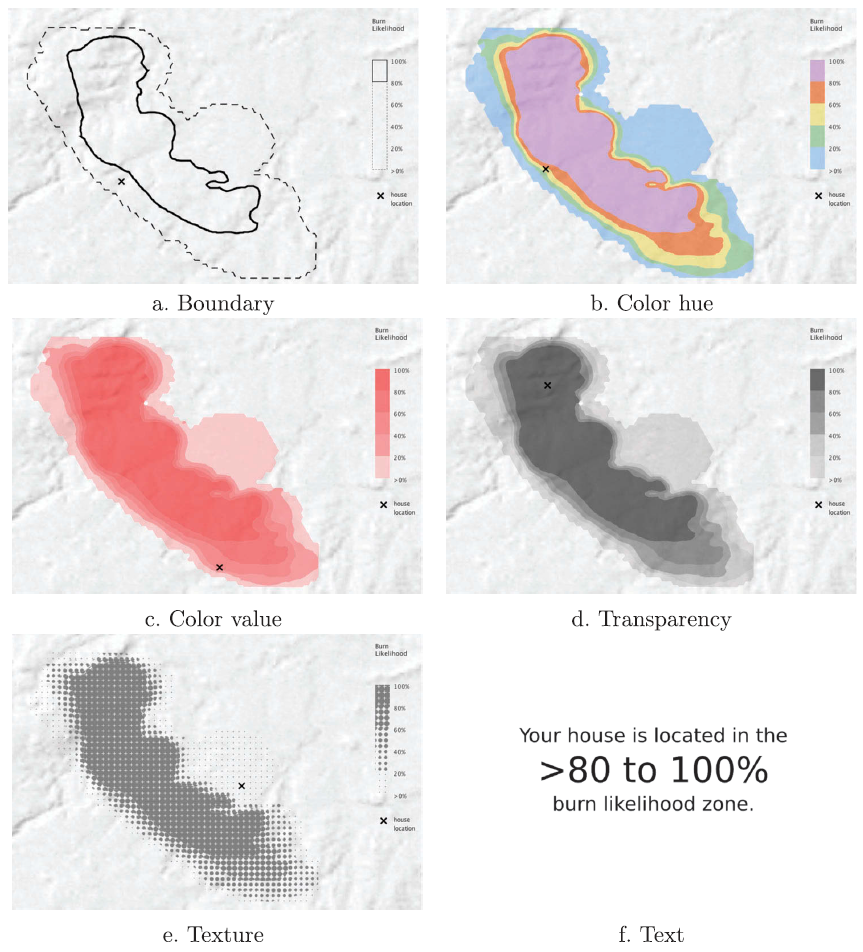
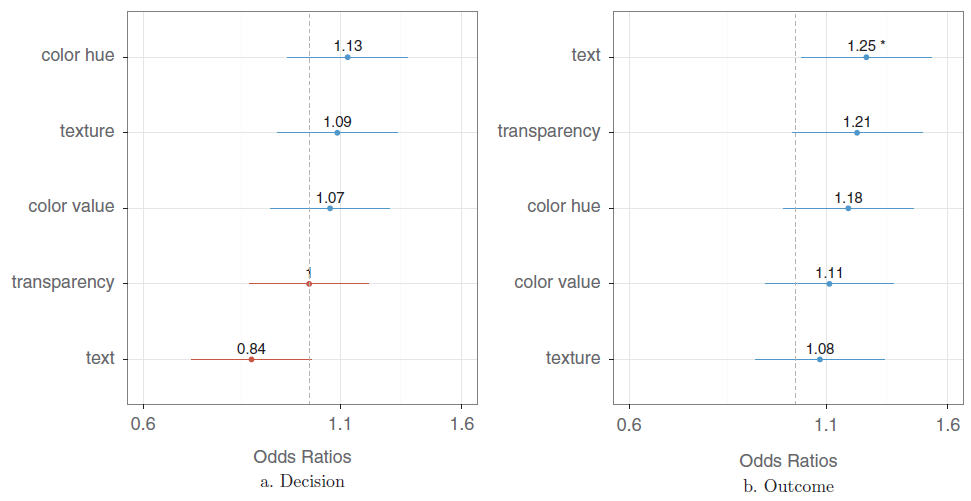
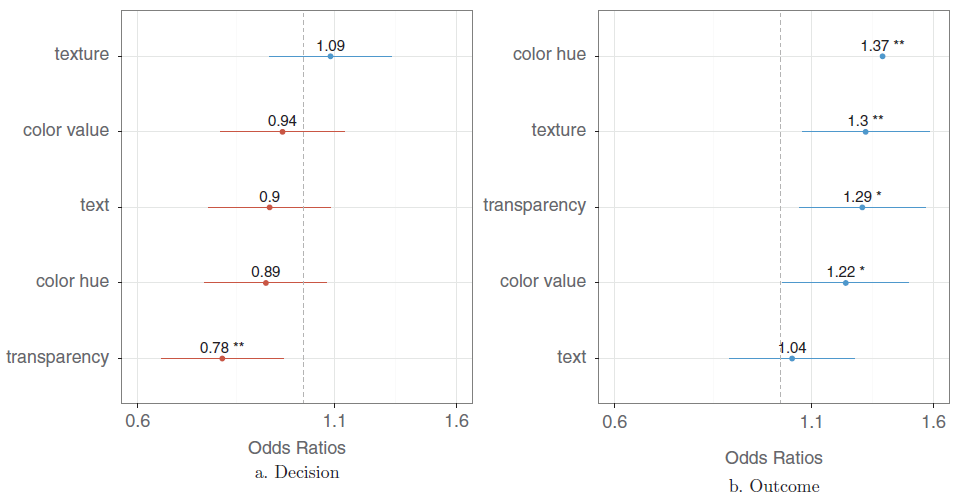
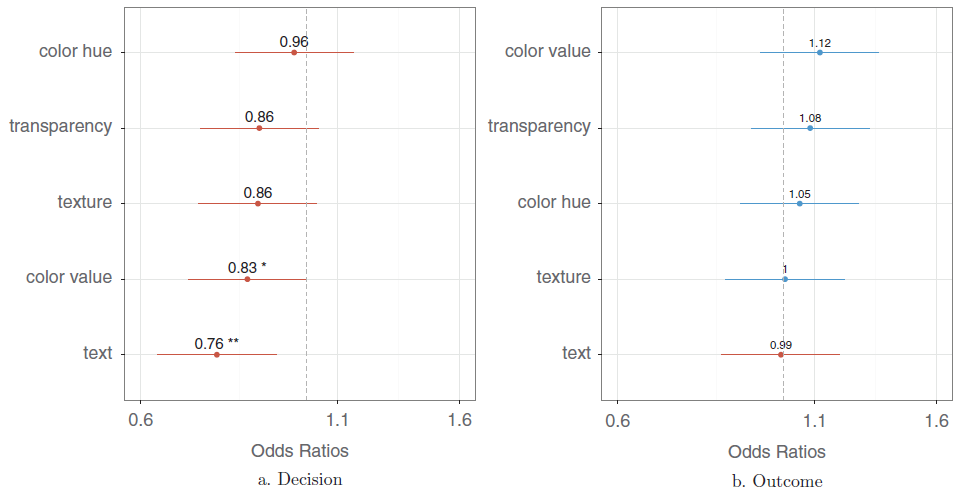
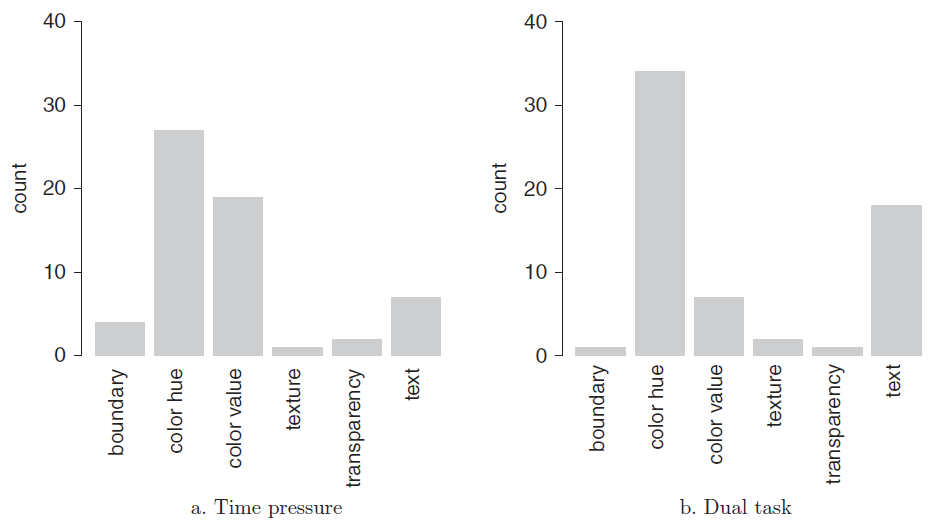
The paper investigates whether the methods chosen for representing uncertain geographic information aid or impair decision-making in the context of wildfire hazard. Through a series of three human subject experiments, utilizing 180 subjects and employing increasingly difficult tasks, this research evaluates the effect of five different visualizations and a text-based representation on decision-making under uncertainty. Our quantitative experiments focus specifically on the task of decision-making under uncertainty, rather than the task of reading levels of uncertainty from the map. To guard against the potential for generosity and risk seeking in decision-making under uncertainty, the experimental design uses performance-based incentives. The experiments showed that the choice of representation makes little difference to performance in cases where subjects are allowed the time and focus to consider their decisions. However, with the increasing difficulty of time pressure, subjects performed best using a spectral color hue-based representation, rather than more carefully designed cartographic representations. Text-based and simplified boundary encodings were among the worst performers. The results have implications for the performance of decision-making under uncertainty using static maps, especially in the stressful environments surrounding an emergency.
Figures
BibTeX
@article{cheong_evaluatingImpactVisOfWildfireHazard_2016,
 abstract = {The paper investigates whether the methods chosen for representing uncertain geographic information aid or impair decision-making in the context of wildfire hazard. Through a series of three human subject experiments, utilizing 180 subjects and employing increasingly difficult tasks, this research evaluates the effect of five different visualizations and a text-based representation on decision-making under uncertainty. Our quantitative experiments focus specifically on the task of decision-making under uncertainty, rather than the task of reading levels of uncertainty from the map. To guard against the potential for generosity and risk seeking in decision-making under uncertainty, the experimental design uses performance-based incentives. The experiments showed that the choice of representation makes little difference to performance in cases where subjects are allowed the time and focus to consider their decisions. However, with the increasing difficulty of time pressure, subjects performed best using a spectral color hue-based representation, rather than more carefully designed cartographic representations. Text-based and simplified boundary encodings were among the worst performers. The results have implications for the performance of decision-making under uncertainty using static maps, especially in the stressful environments surrounding an emergency.},
 author = {Cheong, Lisa and Bleisch, Susanne and Kealy, Allison and Tolhurst, Kevin and Wilkening, Tom and Duckham, Matt},
 doi = {10.1080/13658816.2015.1131829},
 journal = {International Journal of Geographical Information Science},
 number = {7},
 pages = {1377--1404},
 title = {Evaluating the impact of visualization of wildfire hazard upon decision-making under uncertainty},
 url = {https://www.tandfonline.com/doi/full/10.1080/13658816.2015.1131829},
 urldate = {2026-03-25},
 volume = {30},
 year = {2016}
}