Collaborative Group Engagement (CoGE) - Framework & Dashboard

Report
The Collaborative Group Engagement (CoGE) Framework represents a data-based and data-driven approach for assessing the quality and dynamics of collaborative group engagement within computer-supported learning …
Author

Bronowicz, C., Jeitziner, L., Gasparik, M., Vogel, V., Paneth, L., Rack, O., Zahn, C., and Bleisch, S.

Published

2025

Doi

[pdf] [Zenodo] [CoGE Dashboard Protoype]

Abstract

The Collaborative Group Engagement (CoGE) Framework represents a data-based and data-driven approach for assessing the quality and dynamics of collaborative group engagement within computer-supported learning environments. It integrates multimodal indicators of group activity and interaction to provide a foundation for analyzing how learners collaborate, engage with shared tasks, and utilize the available digital workspace. An anonymized excerpt of the underlying dataset, together with selected code components used for generating the prototype dashboard, is made publicly available in the archive coge_dashboard.zip. This package also includes documentation detailing the data processing pipeline, landmark extraction and visualizations (Data_Processing_Pipeline_Documentation.pdf) The CoGE-Dashboard prototype can be accessed at: https://coge-dashboard-b46d14.pages.fhnw.ch/

Figures
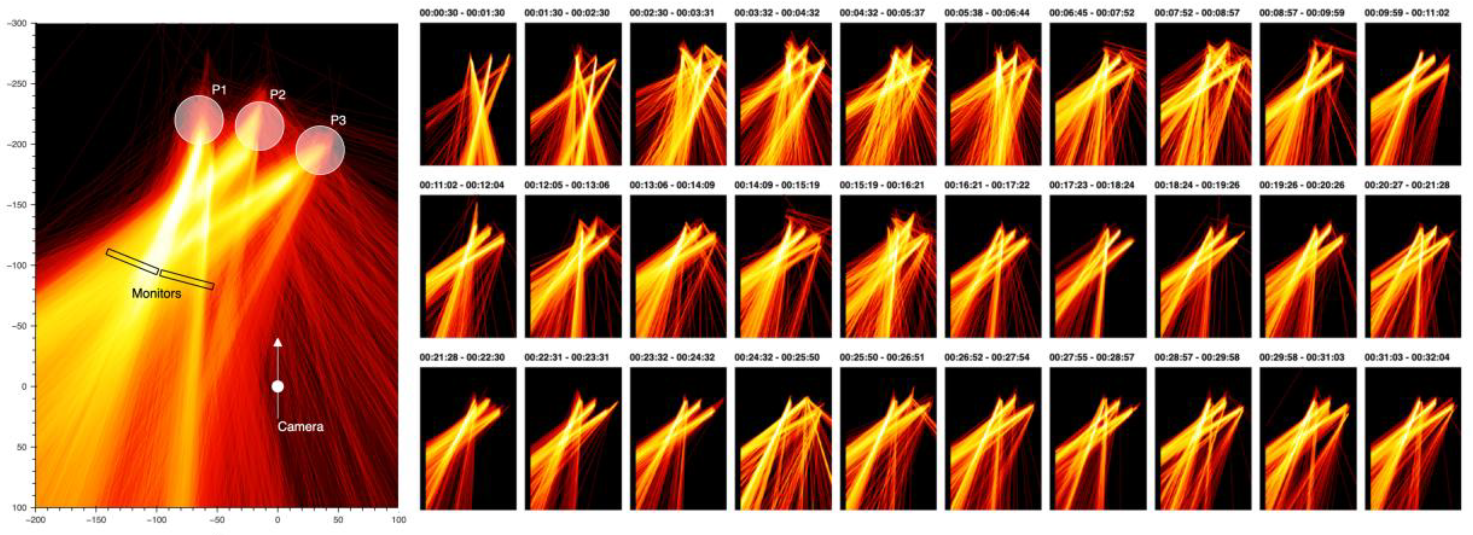
Image-based temporal aggregation of rays representing the facing directions projected to the xz-plane (bird’s-eye view). Left: image obtained by aggregating 30 minutes’ worth of data showing the general extent and distribution of rays. The approximate locations of two computer screens and the camera are indicated for reference. Right: small multiples of images representing consecutive 1-minute long aggregation intervals showing the changes with time. In the nomenclature of space-time (hyper)cube operations by Bach et al. (2014) this correspond to the “time-flattening” operation for the image on left and a compound operation of “time-chopping”, “time-flattening” and “time juxtaposing” for the small multiples, respectively.

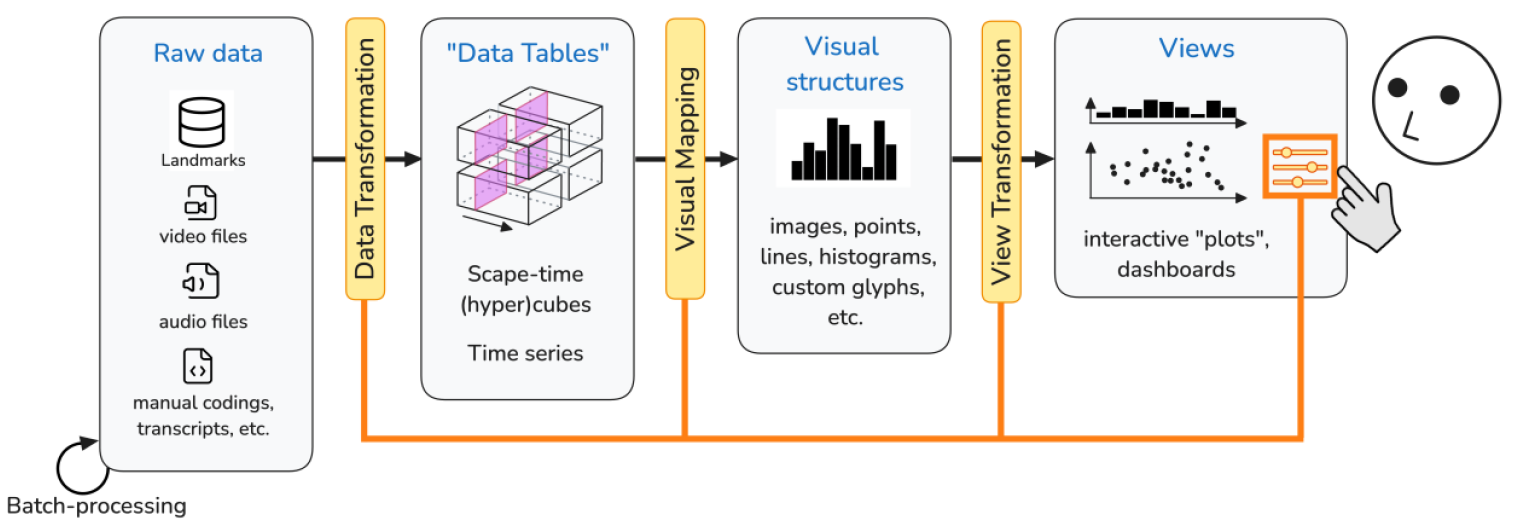
Schematic representation of a visualization pipeline contextualized to the analysis of nonverbal behavior (adapted from the original by Card et al. (1999, pg. 17)).

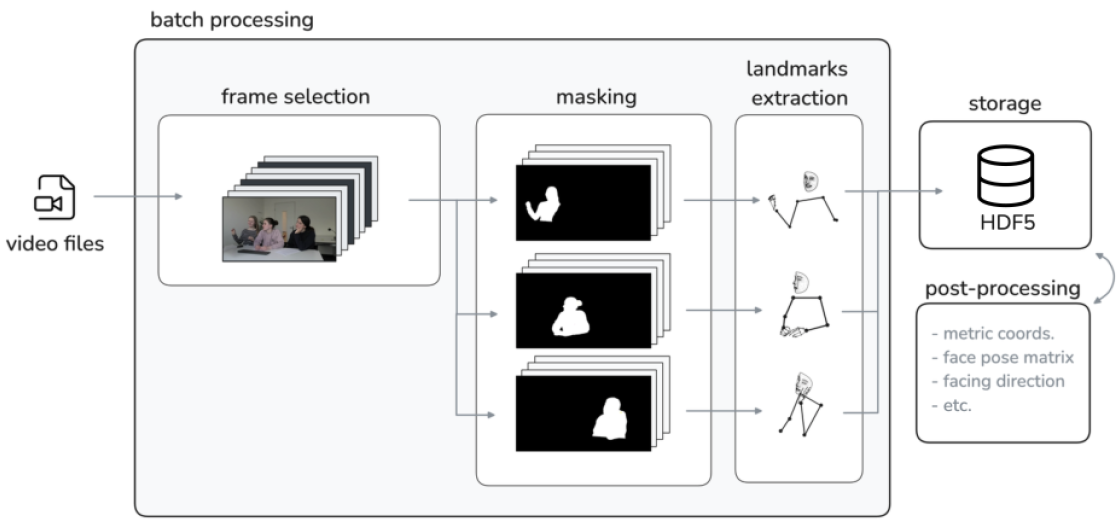
Schematics of the batch-processing pipeline for the extraction of landmarks from video recording.

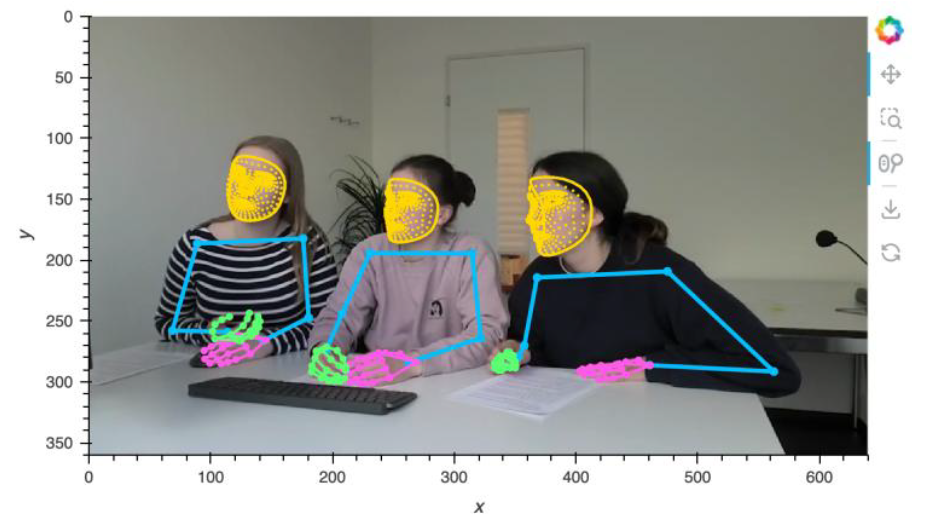
Example of a video frame with extracted landmarks shown as an overlay.

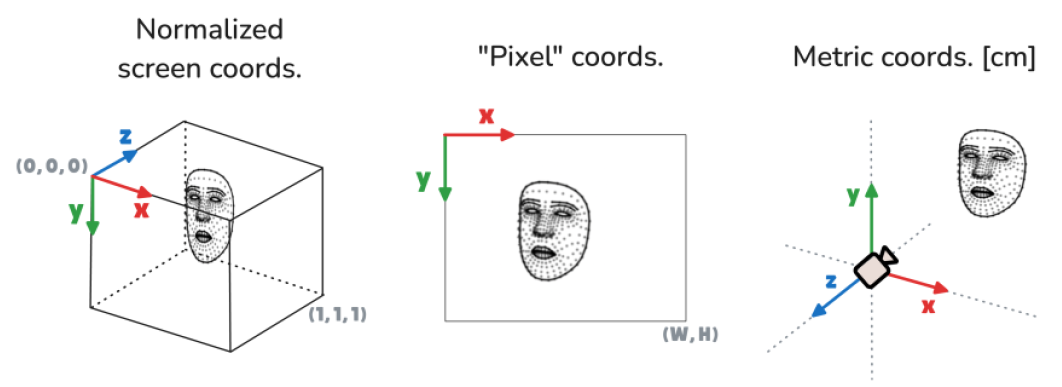
The different coordinate systems used for the landmarks at different stages of the visualization pipeline.

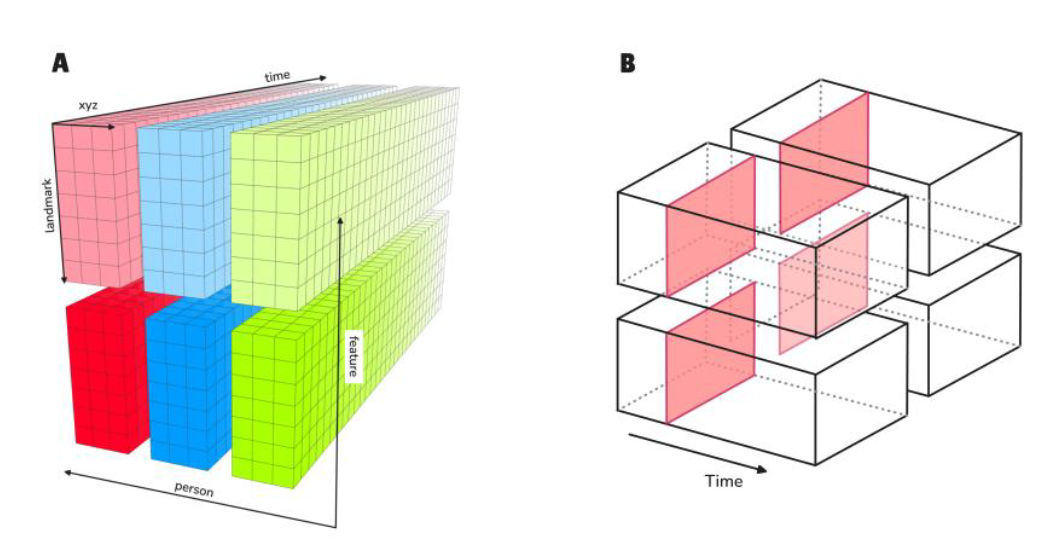
A: Conceptual representation of a data structure used for accessing the landmarks data of an entire group from the HDF5 store as a multi-dimensional array with different dimensions. The “feature” dimension denotes either a set of landmarks corresponding to distinct body parts (face, left hand, etc.) or a derived quantity calculated in the post-processing such as face-mesh position and direction, “landmark” refers to the individual landmark index within a set and “xyz” represent the 3D cartesian coordinates. B: Schematic representation of the “space-time hypercube” conceptual framework as an extension of the space-time cube by Bach et al. (2014) into higher dimensions.

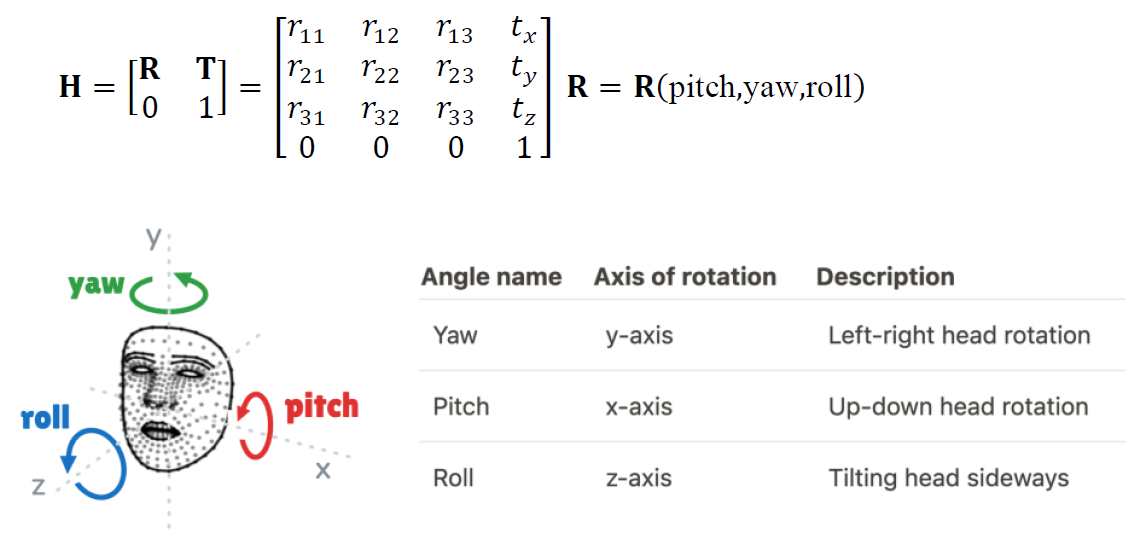
The rotation of the face-mesh around the x-axis (pitch), and its first two derivatives

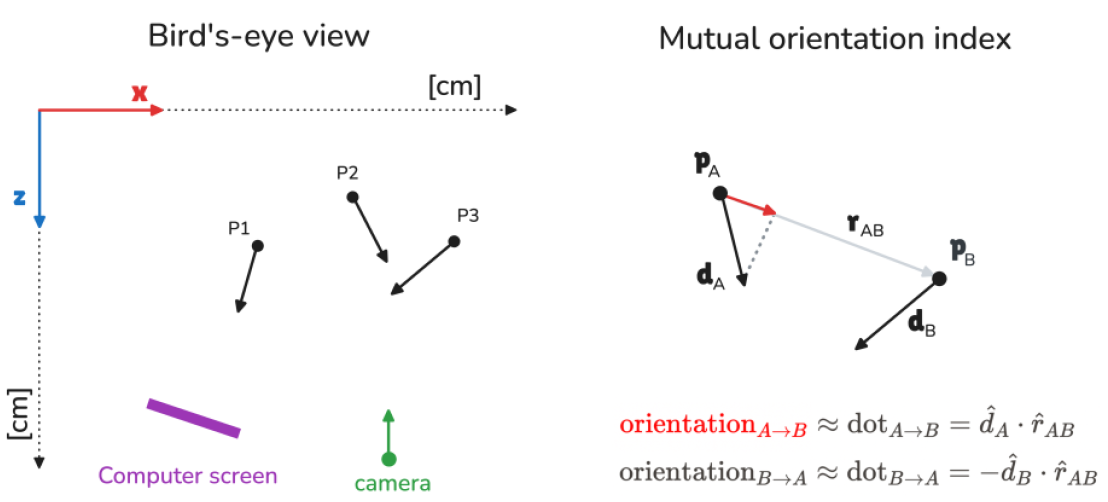
Left: Bird’s-eye view of the recorded scene showing the positions and orientations of the face-meshes for persons P1 to P3 together with the placement of the camera a computer screen in metric coordinates. Right: Vector representation used for the calculation of the “mutual orientation indices” (MOI) between persons “A” and “B”.

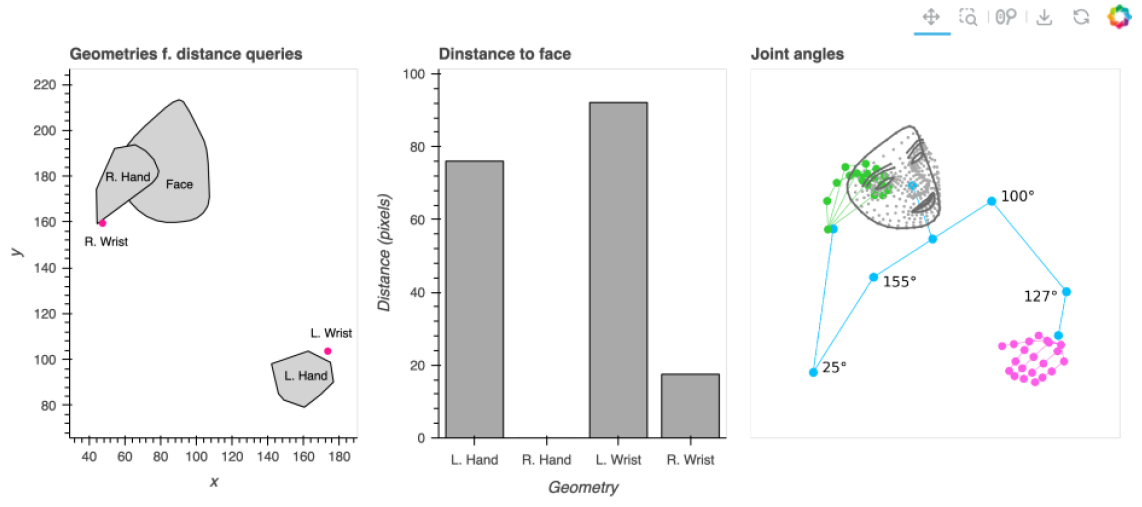
Posture analysis on an example of face-to-hand distance and joint angle geometric queries. (Left) Geometric objects used in face-to-hand distance queries defined as points (wrists) or polygons (face, hands). Middle: distances to face for wrist points and hand polygons, respectively, in pixel units. (Right) Joint angles in degrees.

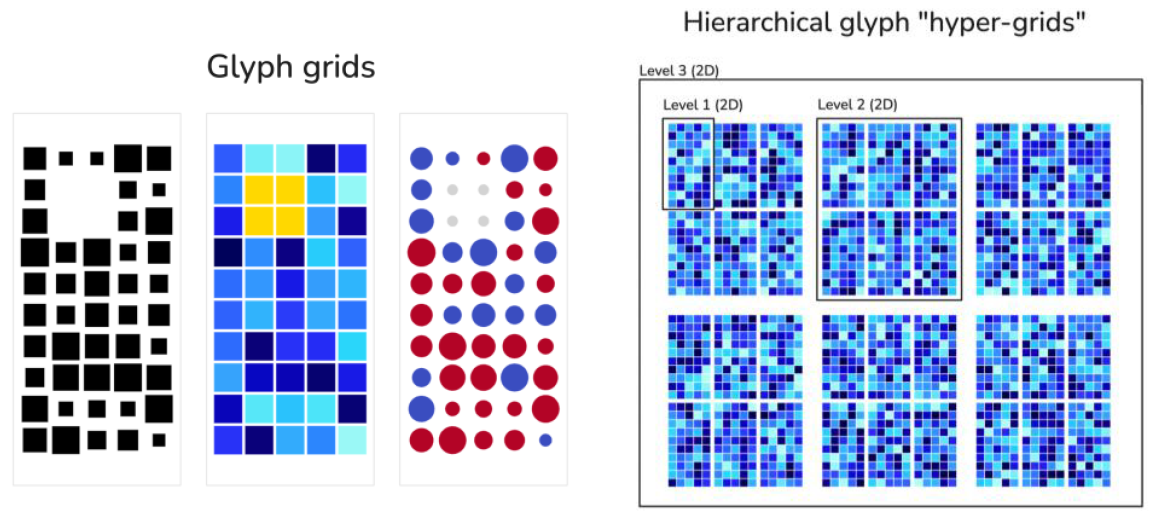
Visualization of higher-dimensional data using “glyph arrays” and “glyph maps”. (left) example glyph arrays of random data with spatial dimensions of 10x5 encoding single or two values using different visual channels (color, size). The shape of the elemental glyph (square or circle) can be chosen deliberately but is not used as a visual encoding. Missing data (2. and 3. columns and rows) can be indicated with a distinct color or size (or both). (right) individual glyph arrays can be arranged hierarchically based on the proximity Gestalt principle to represent higher dimensions on a 2D medium.

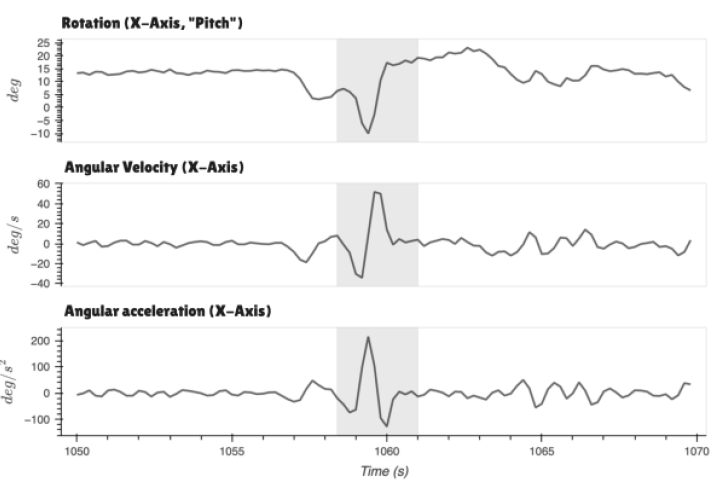
A zoomed-in time-series visualization of the face-mesh rotation around the x-axis (pitch) and its first two derivatives showing a segment corresponding to a head nod (highlighted area).

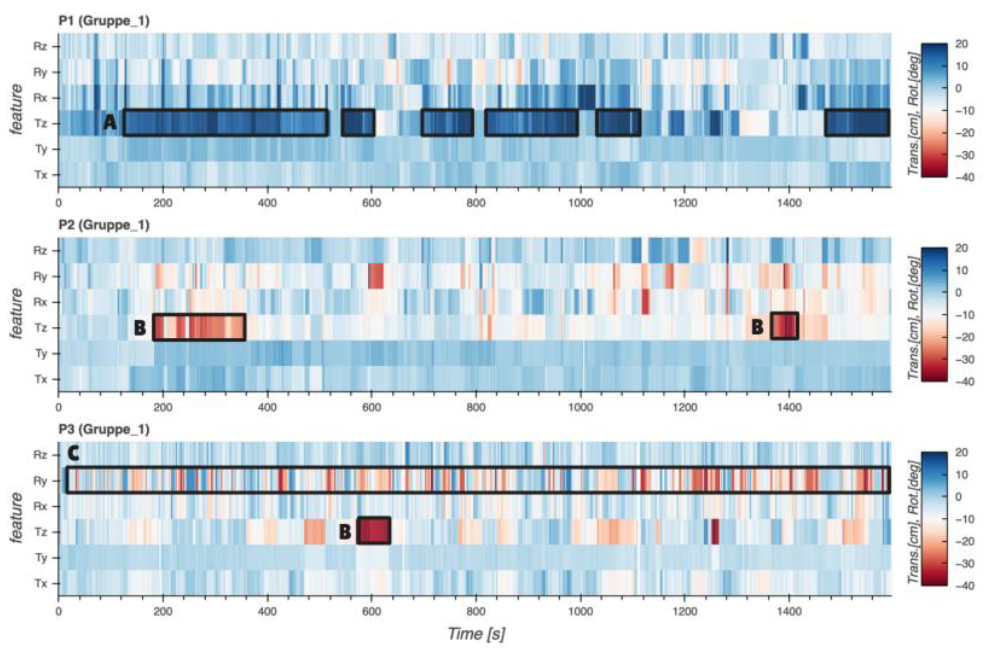
Density maps showing the temporal variations of face positions and orientations represented by the translational (Tx, Ty, Tz) and the rotational (Rx=yaw, Ry=pitch, Rz=roll) components for persons P1, P2 and P3. All values are represented as changes relative to the initial values at time = 0. x,y,z subscripts designate the axes of the metric (camera) coordinate space (Figure 4). Hence, for example a positive (or negative Tz) component represents positions closer to (or further from) the camera (areas A or B, respectively). The positive or negative values for the rotational components designate the sense (clockwise or counter-clockwise) of rotation. Notice the constant switching of the left-right rotation (Ry component) for the person P3 due to a presence of two screens (area C).

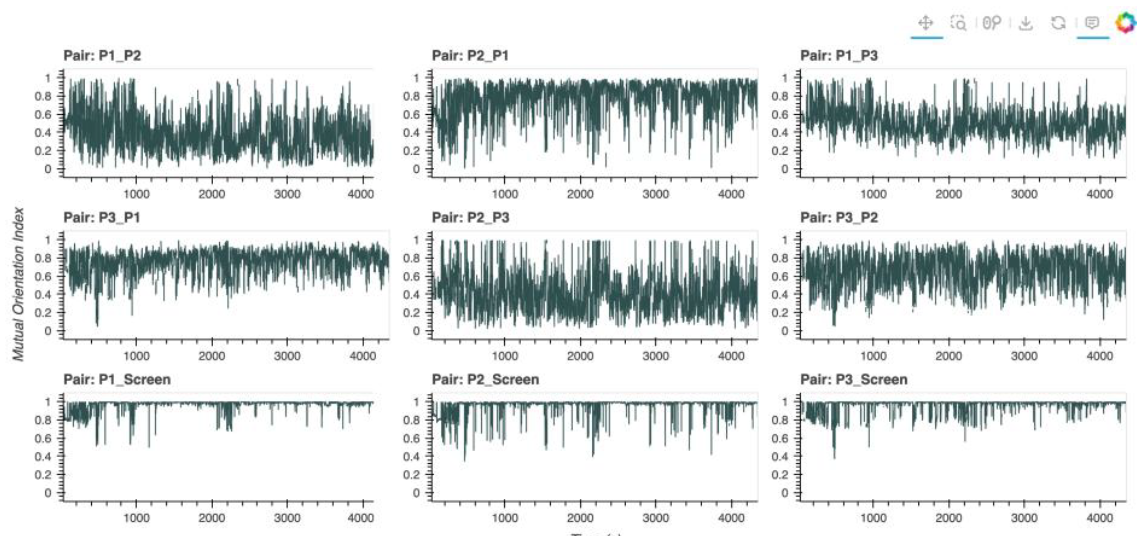
Time series of MOIs between individual persons within a group and between each person and the computer screen. While this kind of visual representation might be useful for revealing the temporal patterns of individual MOIs, it renders the comparison between the MOIs at each time instance impossible.

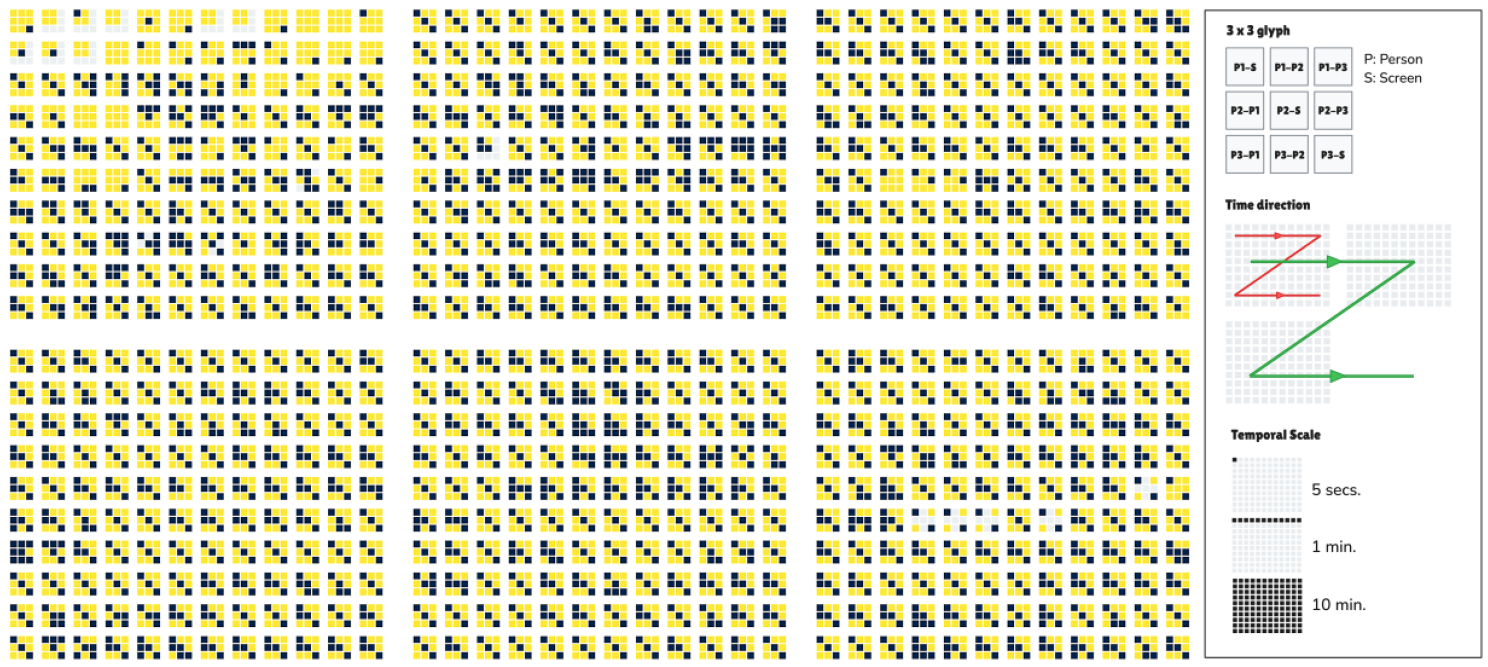
An alternative visual representation of the MOI data (resampled at 5 second intervals and using maximum as aggregation values) based on a custom-designed hierarchical 2D glyph-map. The elementary graphical marks (squares) are organized into hierarchies using the proximity gestalt principle. The color encodes values that are below (yellow) or above (dark blue) an arbitrary, user-controlled threshold MOI value (here, >= 0.94). Referring to the legend on the right-hand-side, the first hierarchy level is as a 3x3 grid of squares representing the MOIs for all pairs and between each person and the computer screen (diagonal elements). Next, the 3x3 square-glyphs are arranged in 12 columns and 10 rows representing increments of 5 seconds and 1 minute, respectively, in consecutive data and containing a total of 10 minutes worth of data. Finally, each of the 10-minute glyphs arrays are laid out in horizontal and vertical arrangement, so as to make efficient use of the available screen (medium) space. The time progression is analogous to the left-to-right text directionality.

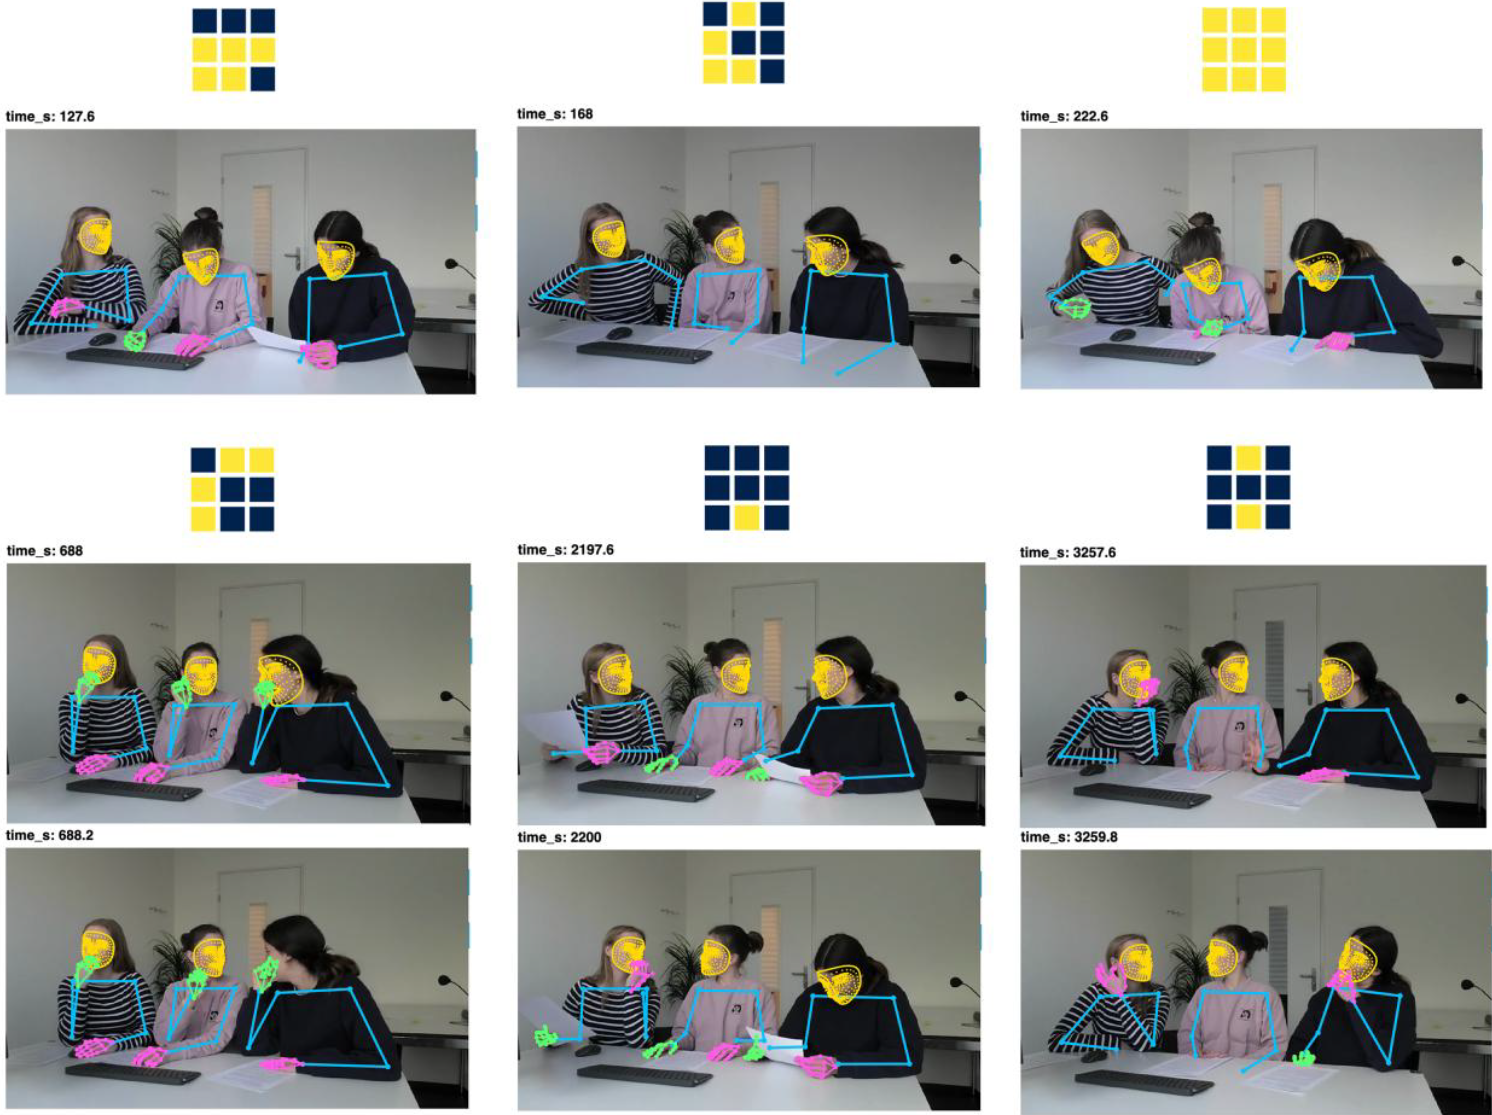
Examples of the 3x3 glyph arrays representing the binarized maximum MOIs during a 5-second segment and 1 or 2 example frames in this time segment that are characteristic for the pattern of the 3x3 glyph array. The example frames are overlaid with the extracted landmarks.

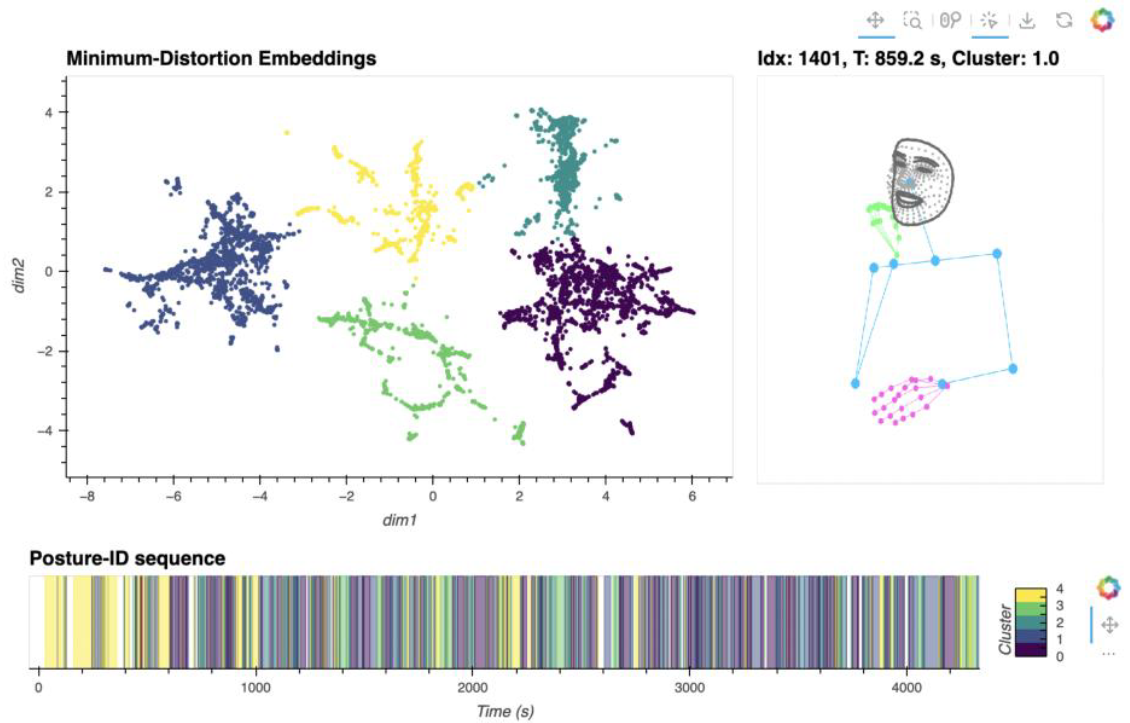
(Left) Visualization of the 2D vector embeddings of feature vectors derived from spatial queries (angles, distances) of the posture. The color-mapping is based on the results of the k-means clustering. Clicking on any point in the embedding plot shows the landmarks for the corresponding sample (right). (Bottom) Temporal sequence of postures belonging to individual clusters.

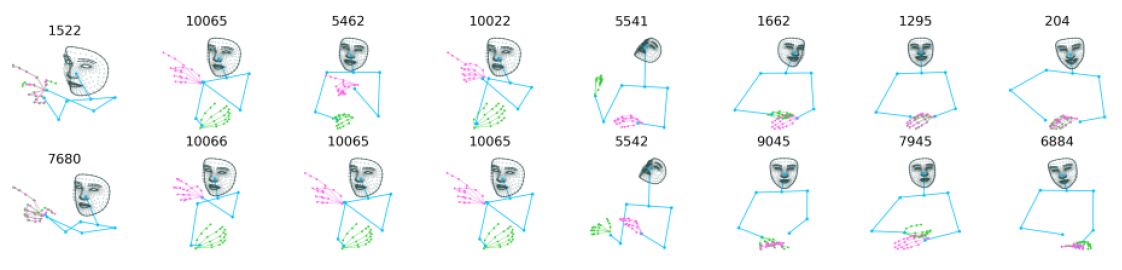
Examples of high-distortion pairs (columns) showing outliers due to erroneous landmarks detections.

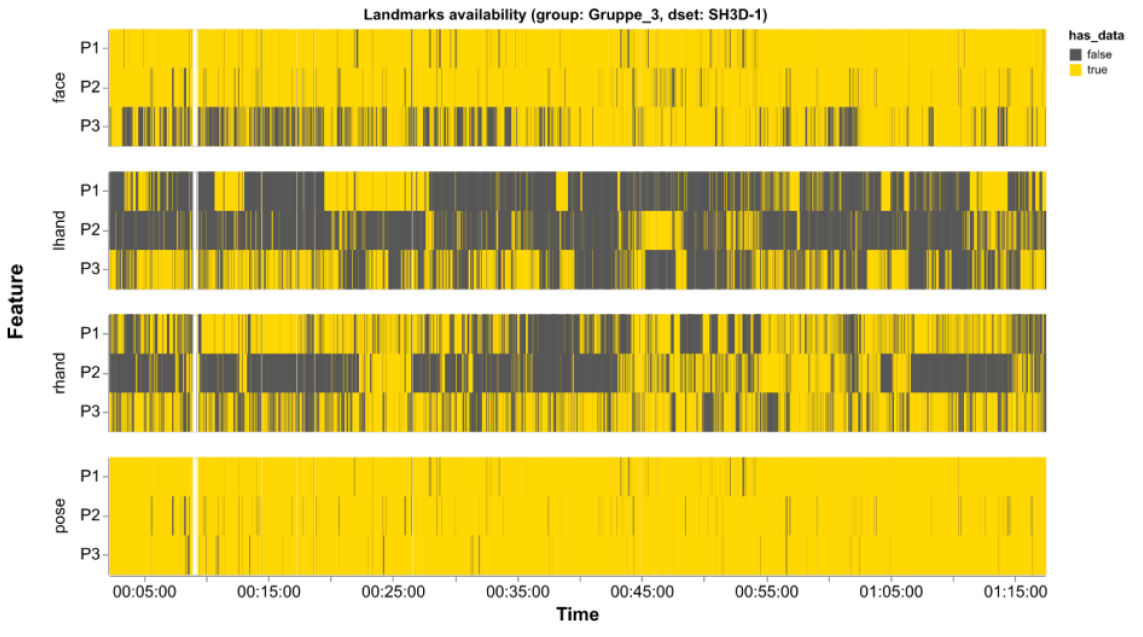
Densitymap showing missing data in the extracted landmarks (i.e. no detection) for each person (P1, P2 and P3) and grouped by the body part. Observe the many missing data for hands resulting mainly from occlusions (e.g. hands under the table).

BibTeX

@techreport{bronowicz_cogeFramework_zenodo_2025,
 abstract = {The Collaborative Group Engagement (CoGE) Framework represents a data-based and data-driven approach for assessing the quality and dynamics of collaborative group engagement within computer-supported learning environments. It integrates multimodal indicators of group activity and interaction to provide a foundation for analyzing how learners collaborate, engage with shared tasks, and utilize the available digital workspace.
An anonymized excerpt of the underlying dataset, together with selected code components used for generating the prototype dashboard, is made publicly available in the archive coge_dashboard.zip. This package also includes documentation detailing the data processing pipeline, landmark extraction and visualizations (Data_Processing_Pipeline_Documentation.pdf)
The CoGE-Dashboard prototype can be accessed at: https://coge-dashboard-b46d14.pages.fhnw.ch/},
 author = {Bronowicz, Carolin and Jeitziner, Loris and Gasparik, Matus and Vogel, Valentina and Paneth, Lisa and Rack, Oliver and Zahn, Carmen and Bleisch, Susanne},
 doi = {10.5281/zenodo.14501411},
 institution = {Zenodo},
 title = {Collaborative Group Engagement (CoGE) - Framework & Dashboard},
 url = {https://zenodo.org/records/17608539},
 year = {2025}
}