Quantitative data graphics in 3D desktop-based virtual environments – an evaluation

Peer-reviewed
Journal Article
Author

Bleisch, S., and Dykes, J.

Published

2015

Doi

[pdf]

Abstract

Figures

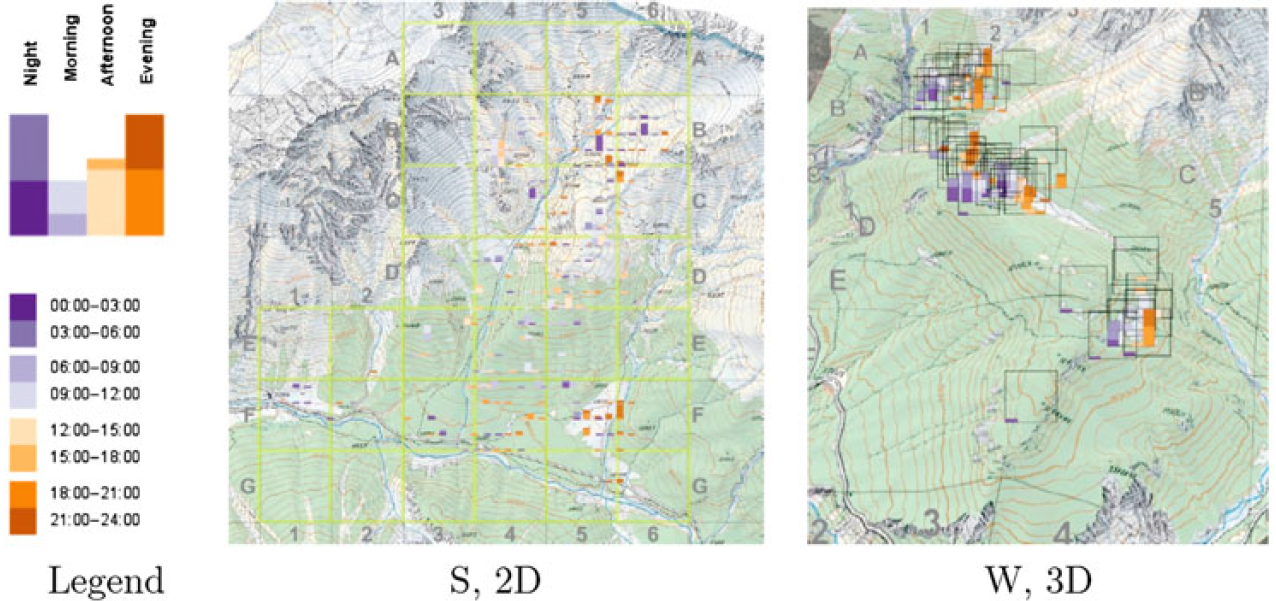
Quantitative data and map background (1:25000 © 2014 swisstopo [BA14010]) of the two different settings (W and S) either in 2D (HTML, SVG, and JavaScript) or 3D (Google Earth).

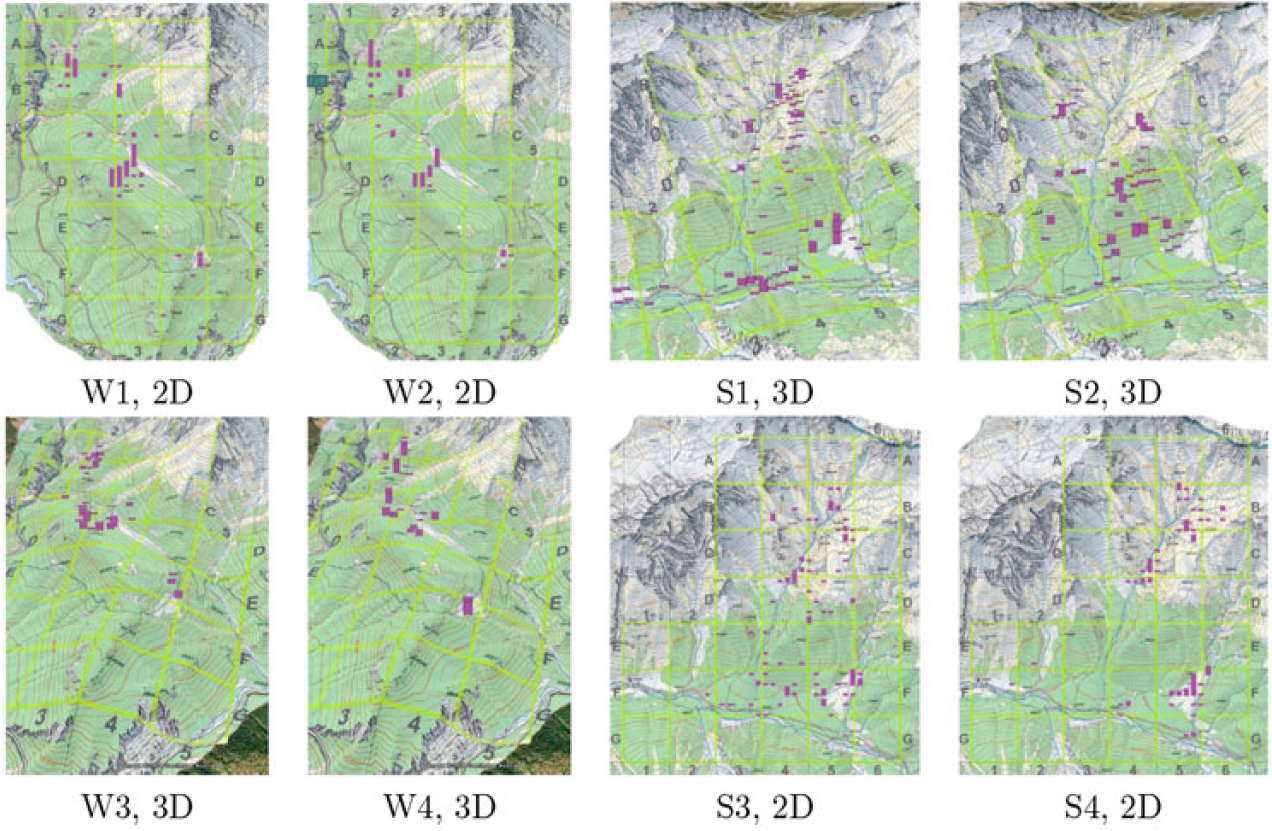
Quantitative data and map background (1:25000 © 2014 swisstopo [BA14010]) of the eight different settings (W1–W4, S1–S4) in the 2D (HTML, SVG, and JavaScript, left pairs) and 3D (Google Earth, right pairs) settings.

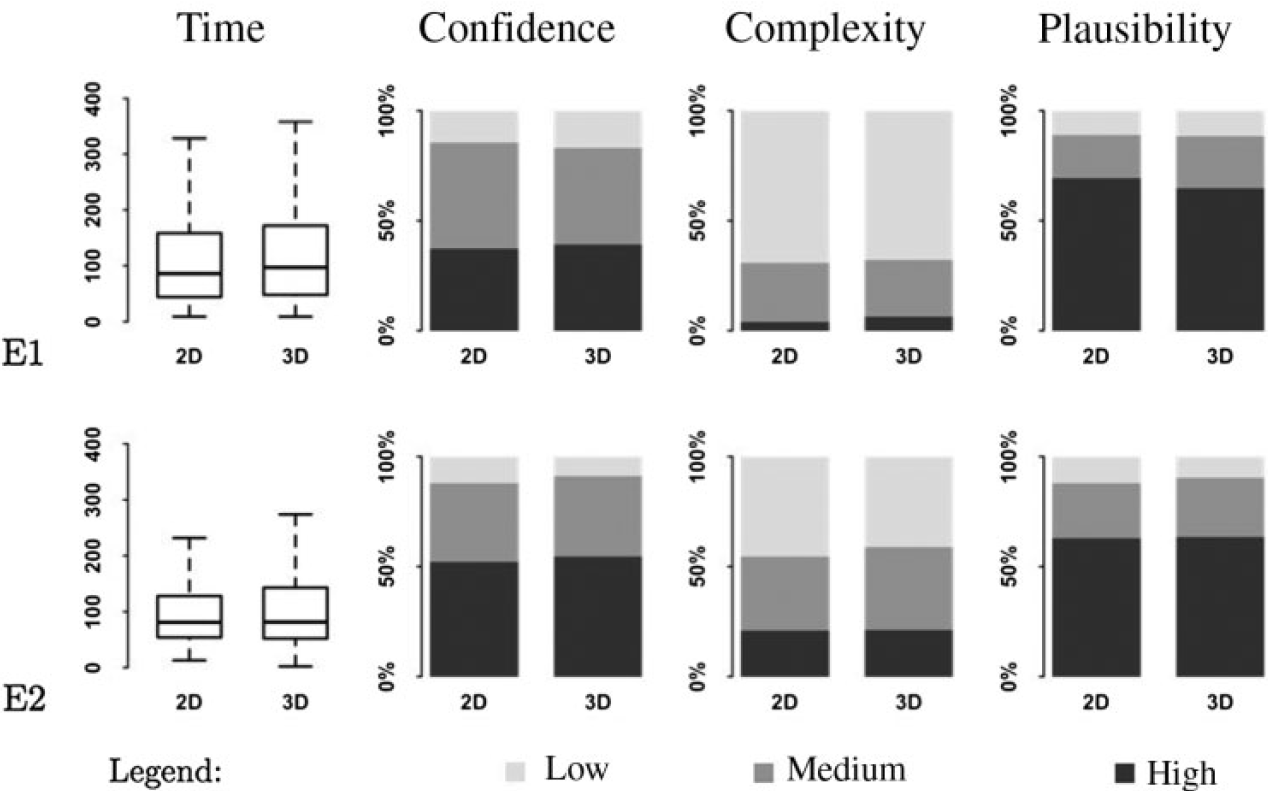
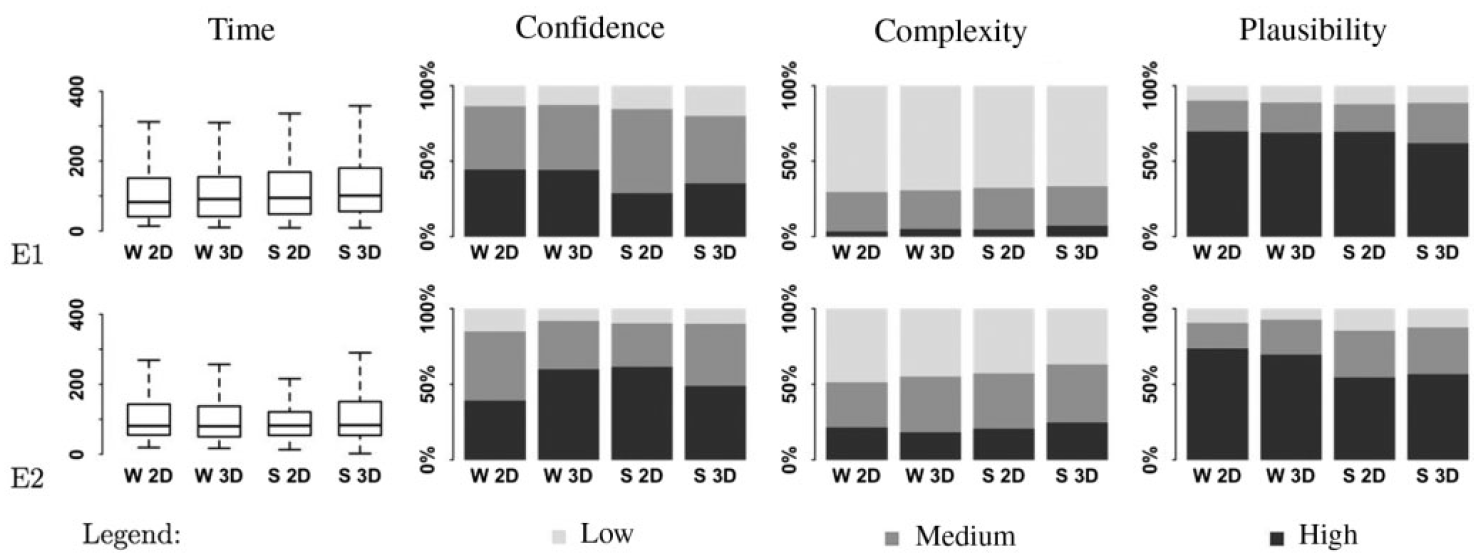
Comparison of the performance measures time, confidence, complexity, and plausibility (columns) between 2D and 3D for the Experiments E1 and E2 (rows). No statistically significant differences were found at a significance level of 95%.

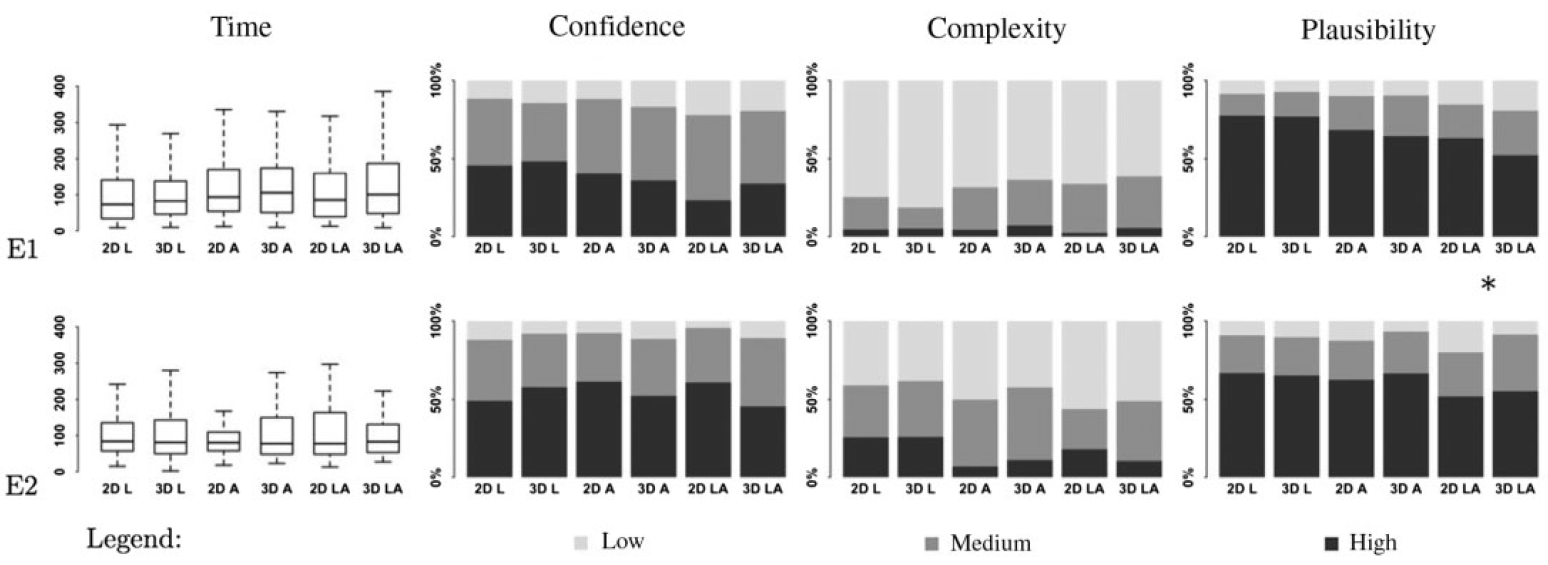
Comparison of the performance measures time, confidence, complexity, and plausibility (columns) between the different reference sets of the insights in 2D and 3D for the Experiments E1 and E2 (rows). Generally, no statistically significant differences (at significance level 95%) were found between 2D and 3D for the different reference sets. The only statistically significant difference was in E1 for plausibility ratings with reference set LA (combination of location and altitude) between 2D and 3D (marked with *; χ2 = 6.09, df = 2, p-value = 0.048).

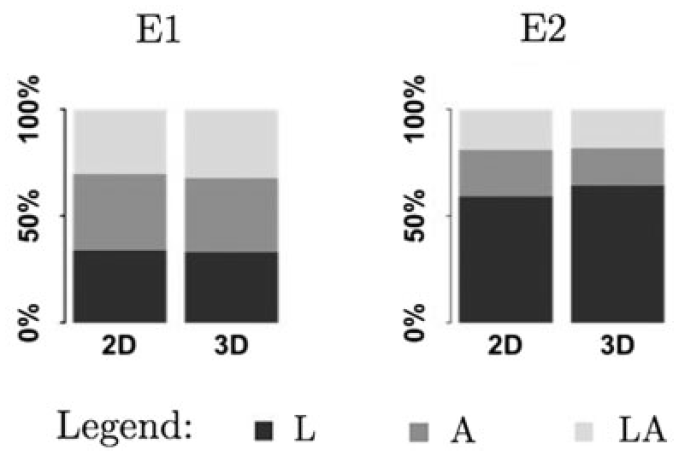
Comparison of relative quantities of reference set usage (location L, altitude A, or both LA) in the insights reported in E1 and E2.

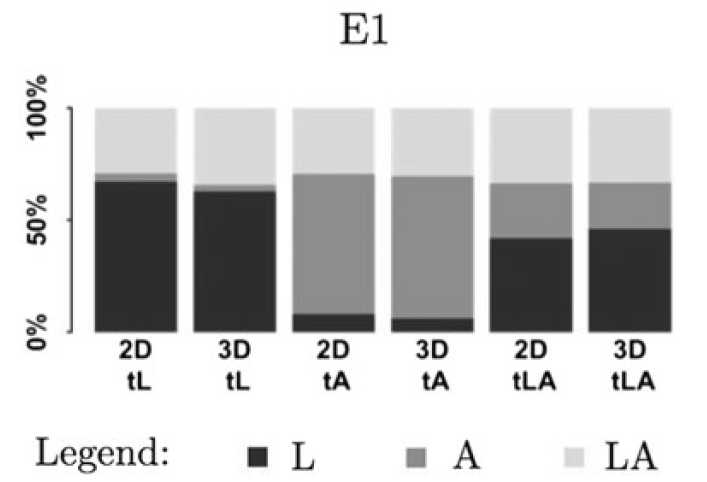
Comparison of relative quantities of reference set usage (location L, altitude A, or both LA) in the insights reported in E1 compared to the task references (tasks referring to location [tL], tasks referring to altitude [tA], and tasks referring to a combination of location and altitude [tLA]).

Comparing the performance measures time, confidence, complexity, and plausibility for the different settings (W and S) between 2D and 3D in Experiment E1 and E2.

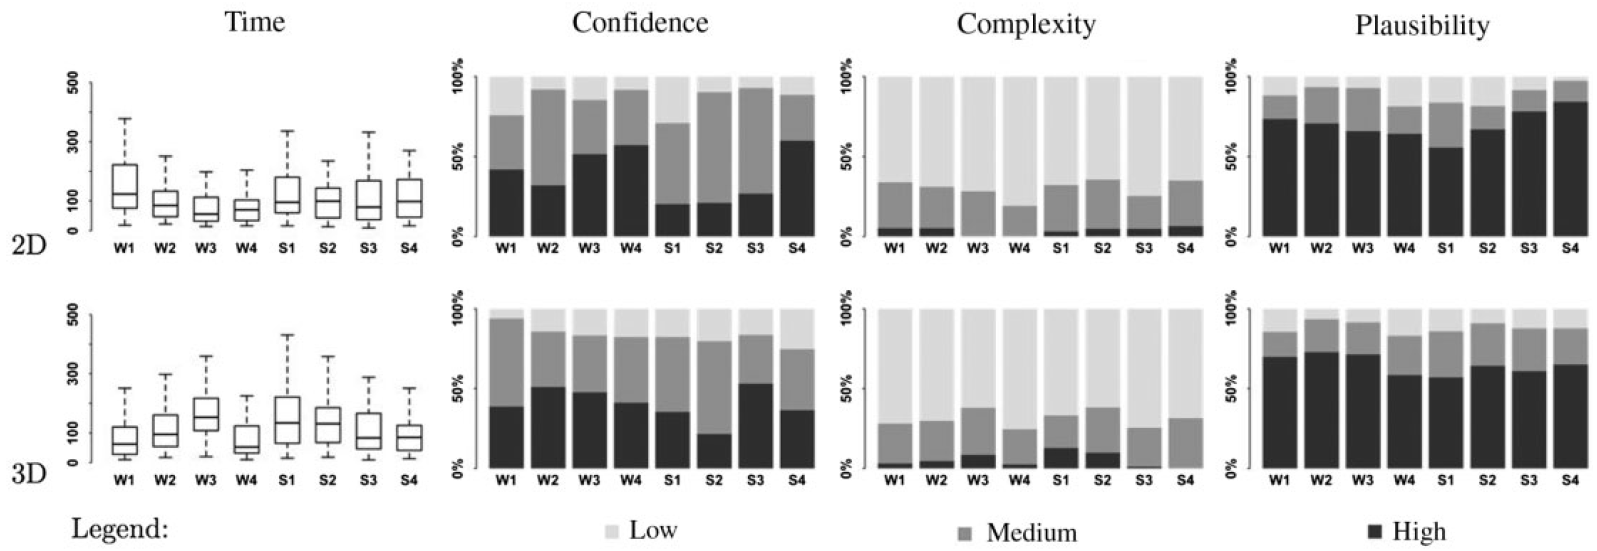
Comparing the performance measures time, confidence, complexity, and plausibility for the different datasets and settings (W1–W4 and S1–S4) between 2D and 3D.

BibTeX

@article{bleisch_quantitativeDataGraphicsIn3DVE_2015,
 author = {Bleisch, Susanne and Dykes, Jason},
 doi = {10.1080/17538947.2014.927536},
 journal = {International Journal of Digital Earth},
 number = {8},
 pages = {623--639},
 title = {Quantitative data graphics in {3D} desktop-based virtual environments – an evaluation},
 url = {http://www.tandfonline.com/doi/full/10.1080/17538947.2014.927536},
 volume = {8},
 year = {2015}
}