Exploring multivariate representations of indices along linear geographic features
Abstract
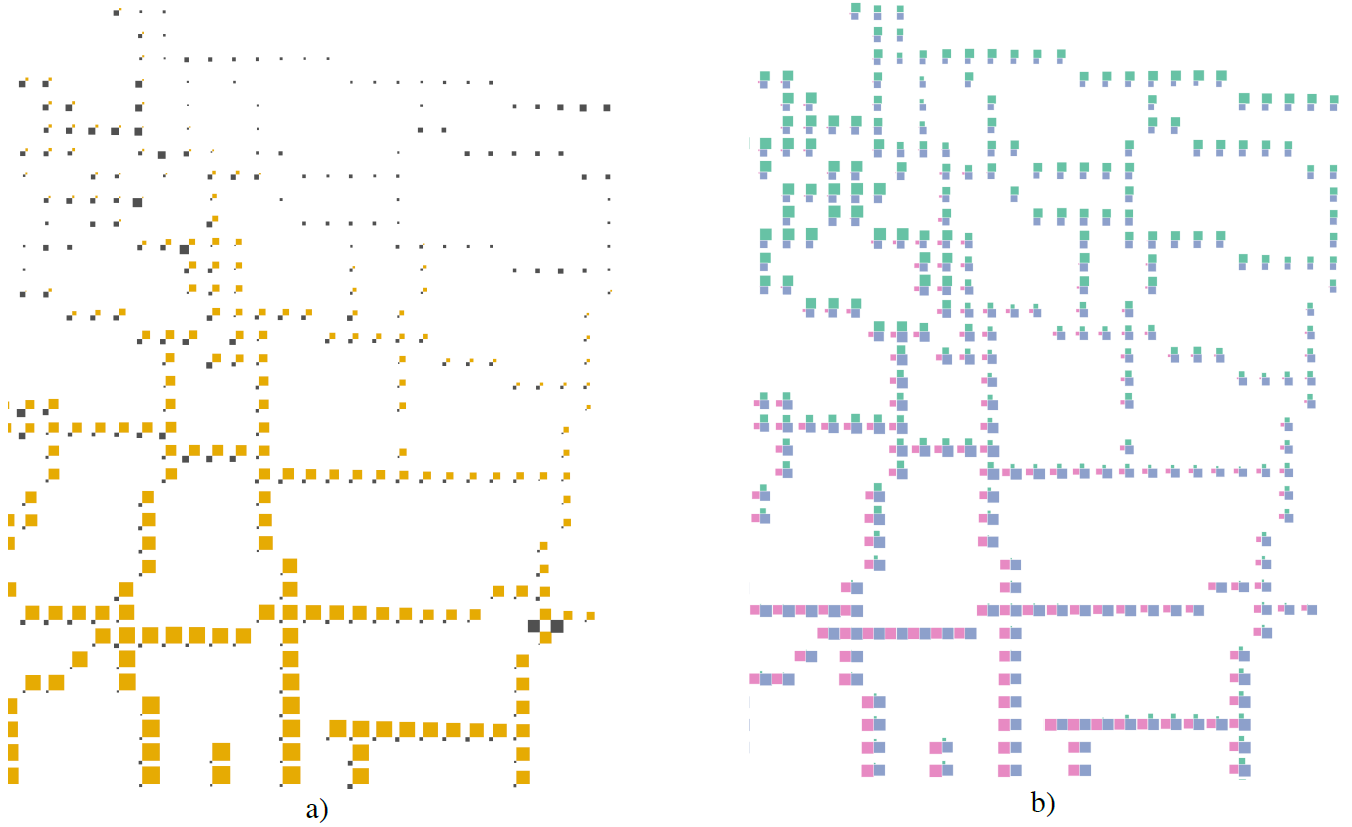
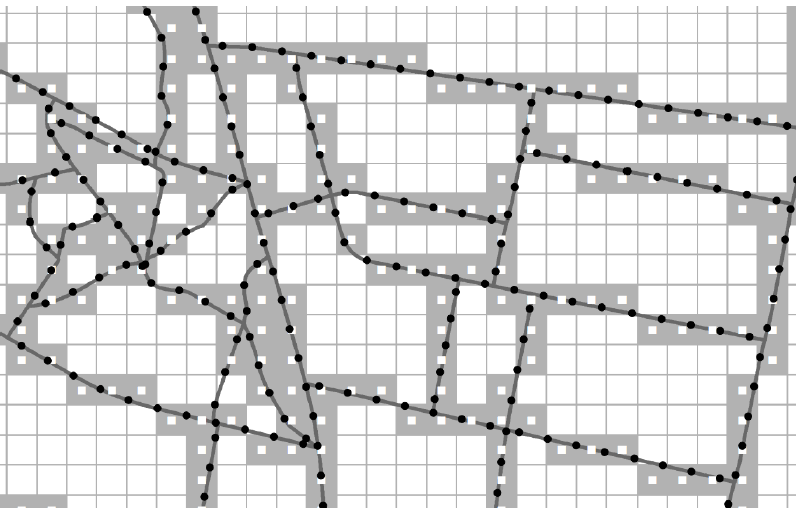
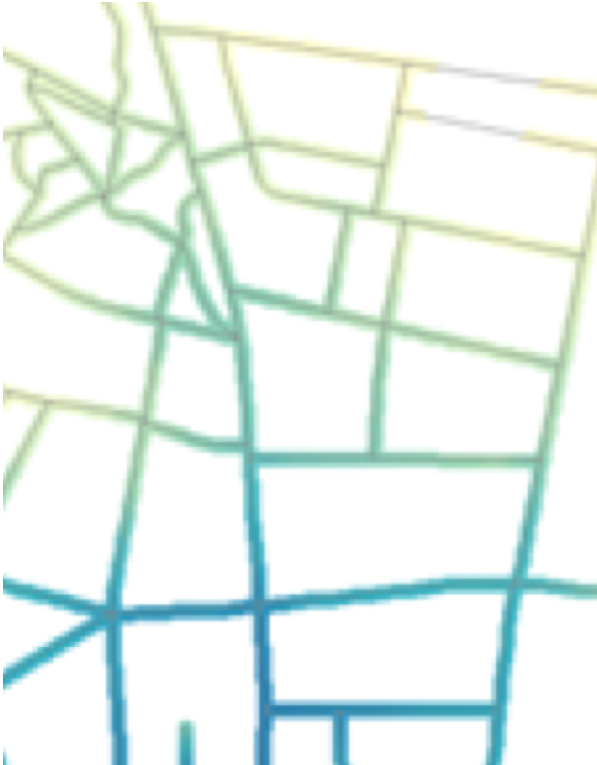
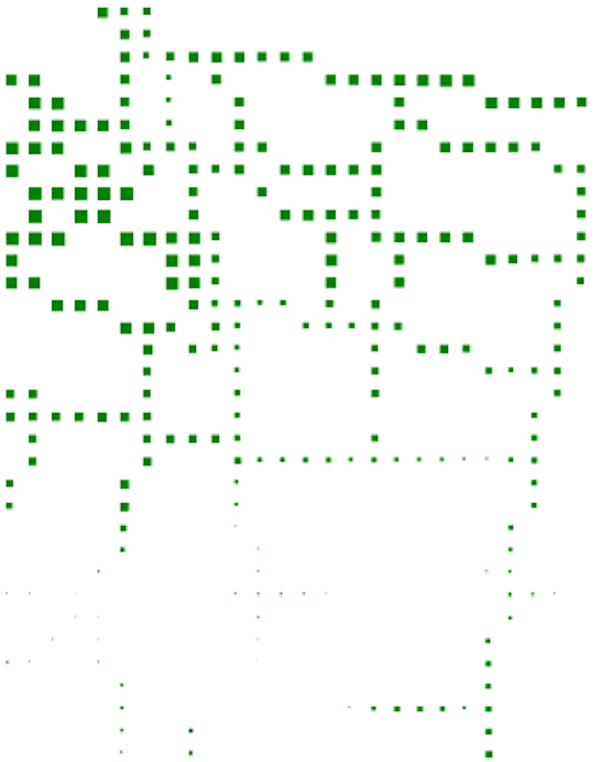
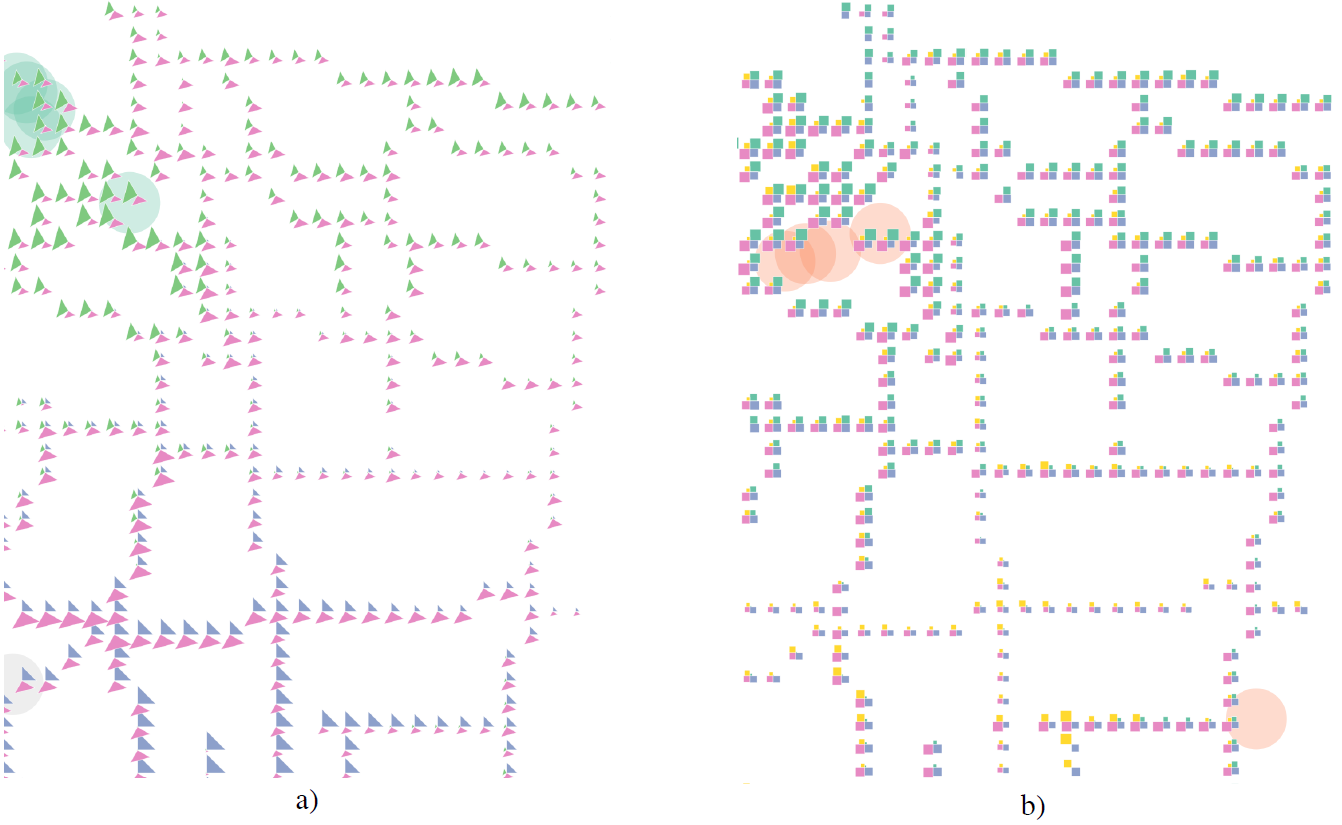
A study of the walkability of a Swiss town required finding suitable representations of multivariate geographical data. The goal was to represent multiple indices of walkability concurrently and visualizing the data along the street network it relates to. Different indices of pedestrian friendliness were assessed for short street sections and then mapped to an overlaid grid. Basic and composite glyphs were designed using square- or triangle-areas to display one to four index values concurrently within the grid structure. Color was used to indicate different indices. Implementing visualizations for different combinations of index sets, we find that single values can be emphasized or de-emphasized by selecting the color scheme accordingly and that different color selections either allow perceiving single values or overall trends over the evaluated area. Values for up to four indices can be displayed in combination within the resulting geovisualizations and the underlying gridded road network references the data to its real world locations.
Figures

BibTeX
@article{bleisch_exploringMultivariateIndicesAlongLinearFeatures_2018,
 abstract = {A study of the walkability of a Swiss town required finding suitable representations of multivariate geographical data. The goal was to represent multiple indices of walkability concurrently and visualizing the data along the street network it relates to. Different indices of pedestrian friendliness were assessed for short street sections and then mapped to an overlaid grid. Basic and composite glyphs were designed using square- or triangle-areas to display one to four index values concurrently within the grid structure. Color was used to indicate different indices. Implementing visualizations for different combinations of index sets, we find that single values can be emphasized or de-emphasized by selecting the color scheme accordingly and that different color selections either allow perceiving single values or overall trends over the evaluated area. Values for up to four indices can be displayed in combination within the resulting geovisualizations and the underlying gridded road network references the data to its real world locations.},
 author = {Bleisch, Susanne and Hollenstein, Daria},
 doi = {10.5194/ica-proc-1-11-2018},
 journal = {Proceedings of the ICA},
 title = {Exploring multivariate representations of indices along linear geographic features},
 url = {https://ica-proc.copernicus.org/articles/1/11/2018/},
 year = {2018}
}